Lesson 10 Current Trends in Geoinformatics
10.1 Introduction
Due to ever shorter innovation cycles and enormous advances in all areas relevant to GIS, describing trends in Geoinformatics is a rather risky undertaking. Even as these lines are being written, they are already in danger of being outdated. New ideas and applications appear at a rapid pace, while supposed trends burn up like shooting stars on the (GI-)horizon. In this highly dynamic environment, technological developments have emerged over the past 10–15 years that fundamentally define the framework for innovations in Geoinformatics. Without going into detail at this point, the following parameters should be mentioned:
- increasing computing power
- miniaturisation of sensors
- increasing volume, availability, and accessibility of data
- diversity and progress in software development
- rapidly accelerating development cycles in artificial intelligence (AI)
- growth in the size of the GIS community.
These developments are overlaid by two megatrends that extend far beyond the field of Geoinformatics. On the one hand, society is being fundamentally changed through the process of digitalisation: some refer to this, especially with regard to transformations in the industrial sector, as the “fourth industrial revolution” (Industry 4.0). On the other hand, various crises (above all the climate crisis) are forcing societies to adopt a different, more sustainable way of living. The sustainability goals formulated by the United Nations (SDGs) are in many ways becoming the benchmark for politics, economic activity, and social coexistence. The immediate spatial reference of most sustainability goals gives Geoinformatics a key role, as illustrated by the following map application (Figure 10.1):
Figure 10.1: In the Hunger Map of the United Nations World Food Programme, all relevant information is presented directly in a map-based format.
If you want to learn more about the contribution of Geoinformatics to the UN SDGs, please refer to this special issue (open access) of the International Journal of Geo-Information.
Despite some early predictions of the end of Geoinformatics, modelling and analysing spatial data has proven to be a fundamental pillar of the digital society we live in. More than ever, GIS specialists as well as experts with GIS-expertise across different application domains are in high demand. Moreover, the ability to understand and apply geographic concepts and methods - referred to as “spatial literacy” (cf. Bednarz and Kemp (2011)) - is emerging as a key competence in a rapidly growing job market.
In 2020, the United Nations initiative Global Geospatial Information Management (UN GGIM) published the third, updated version of future trends in geospatial information management for the coming years. For anyone interested in the various trends and a detailed analysis of them, please have a look at this document:
Three leading figures in the field of Geoinformatics, who have been or still are affiliated with UC Santa Barbara (USA) - Trisalyn Nelson, Jack Dangermond, and Mike Goodchild - also provide interesting insights into the future of the discipline. In March 2021, they shared their assessments in a webinar, which can be viewed in Figure 10.2 :
Figure 10.2: Video (1hr35min): Webinar on Emerging Trends in GIS.
In addition to these comprehensive resources, numerous online contributions provide assessments of where the field of Geoinformatics may be headed in the future:
- Forbes foresees the boundless future of geospatial data and offers innovative ways of their use in industry and government.
- Geospatial World Technology Trends for 2024.
- Key Trends in Geospatia Techology 2025 by GeoAwsome.
- Geo Week News - Predictions for Geospatial Specialists.
The forecasts from the IT industry are also of interest. Many of the trends mentioned have a direct impact on the field of Geoinformatics:
Throughout this lesson, you will quickly realise that “GIS” is not merely an established method or tool, but a highly dynamic environment with far-reaching implications from professional practice and the everyday use of Geotechnologies to broader societal processes. Have fun!
Upon completion of this lesson, you should be able to:
- Discuss the current and dynamic development of GIS
- Predict and suggest possible future roles of geospatial information
In this lesson, we will address the following topics:
- GeoWeb
- Spatial Enterprise IT
- Ubiquitous Computing and Sensor Networks
- Artificial Intelligence
- Cloud GIS
- Open-Source Software and Open Data
- Multidimensional Modelling (3D, BIM) and Simulation
- The Future of GIS
10.2 Geospatial Web
The Geospatial Web – also known as GeoWeb – refers to full geoservices on the web that go beyond the classical web-based mapping and geospatial visualisation. In 2008, (Dangermond 2008) identified it as a revolutionary development for the next 5 years, which “allows extensive sharing of maps and data, and opens up access to GIS applications to everyone”. …well, he was right!
The basic component of a GeoWeb is a geobrowser: Google Maps, Here Maps, Bing Maps, and OpenStreetMap are prominent examples.
The providers of geobrowsers have managed to achieve something that many governmental and non-governmental institutions have been trying for years: Through extremely simple usability and availability of Application Programming Interfaces (APIs), they have made the extensive use of spatial information by lay people in their everyday life possible.
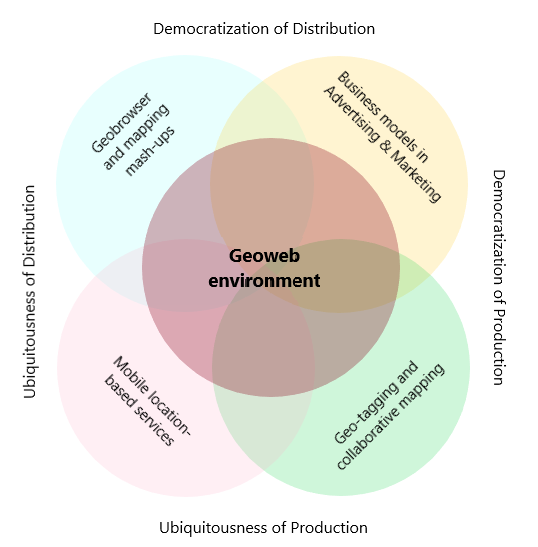
Figure 10.3: Geoweb environment, modified after Thielmann et al. (2012).
- Mash-ups: Merging elements or information from various sources based on their geographical location. The map serves as a platform. See, for example, the Google Blog Maps Mania.
- Tagging: Gathering and assessing location-based information through comments, photos, videos etc.
- Collaborative mapping: Mapping and collecting relevant information on a given topic using the map as a visual interface.
- Location-based services: Information will be delivered to persons with particular preferences and in particular locations, in a timely fashion and directly to his/her smartphone.
Besides the commercial platforms, one interesting social development was established as well: This is the (more or less) voluntary contribution of spatial data sets or Volunteered Geographic Information (VGI). Here, the user is both: a consumer and a producer of spatial information and is, therefore, often referred to as “prosumer”. The most prominent example in such an application area is the OpenStreetMap project.
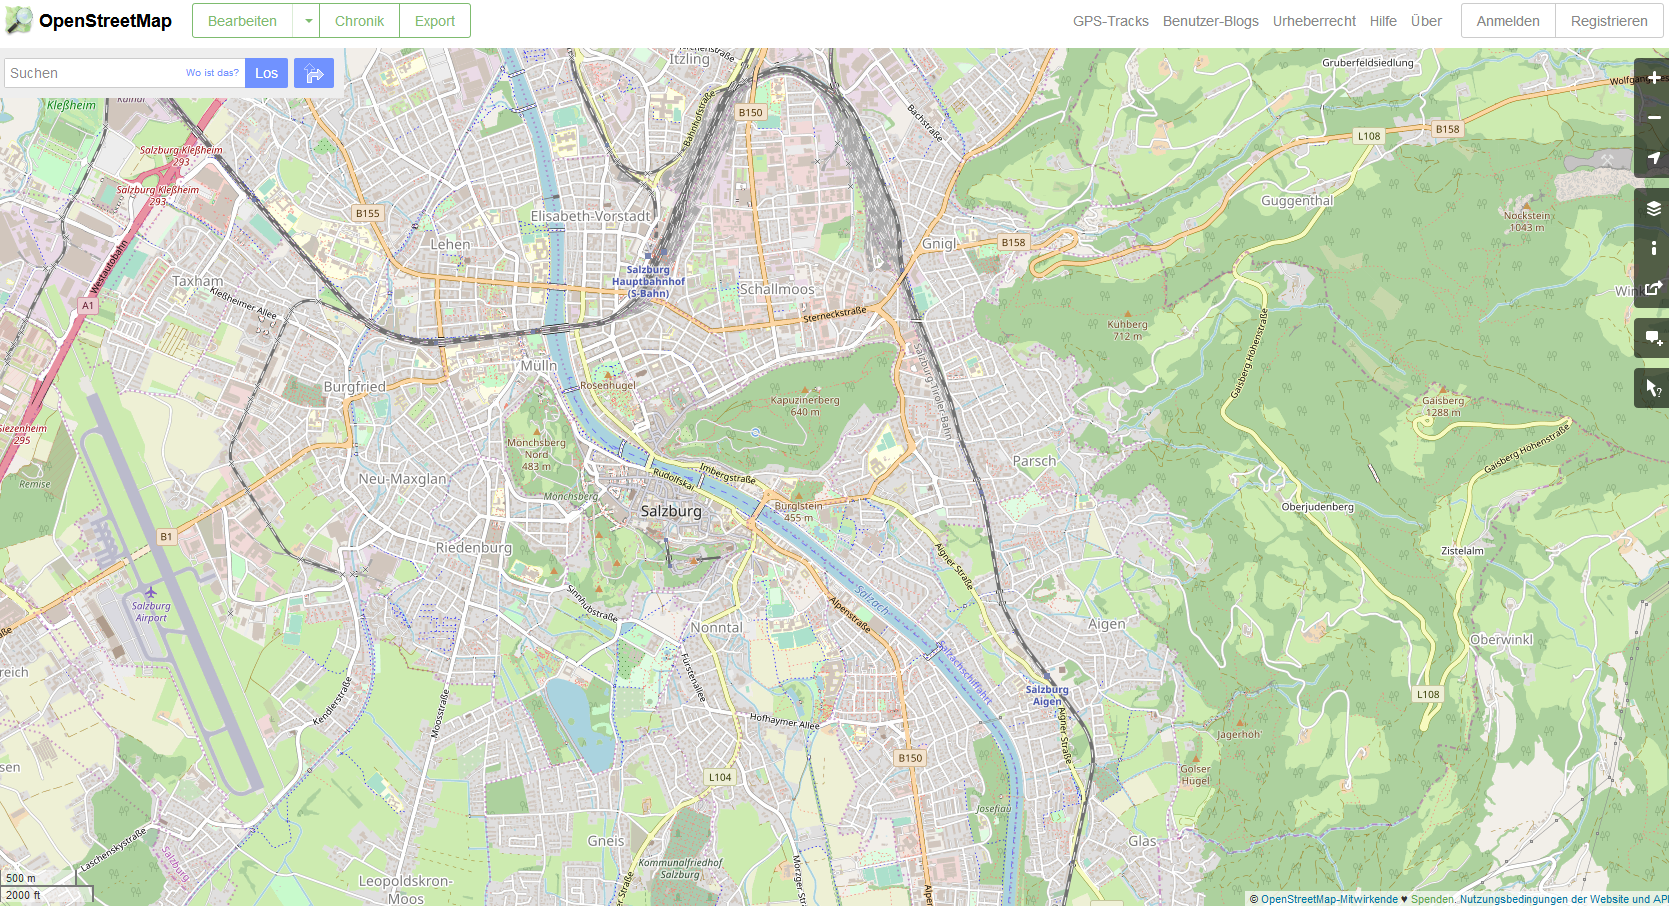
Figure 10.4: OSM for Salzburg.
OpenStreetMap (OSM) was founded in 2004, and aims to create an open and free of charge map of the world. Figure 10.4 shows a clip of the area around the city of Salzburg. The members of the OSM community use GPS devices or digitise spatial data from freely available aerial imagery to collect and verify data. The data from the OSM project can be used freely; no licensing and/or processing fees are required. Meanwhile, OpenStreetMap is much more than just a map. Some parts of OSM data sets are of a much higher quality and more detailed than those available through governmental or business institutions. Consequently, there is an ever-growing number of projects and applications based on OpenStreetMap, for example, concerning accessibility there is an OSM-based map for blind people or those using wheelchairs (wheelchair routing).
The success of the GeoWeb lies in the underlying business models of the companies involved. The enormous costs for the purchase and integration of spatial data are associated with geobrowsers like Google Maps. The classical business model in the GI industry is based on the preparation and sale of GI products. In contrast, GeoWeb uses advertisement/promotion and marketing-based approaches: It facilitates the development of applications for consumers through freely available and, thus, widely used geobrowsers and APIs.
If an application is successful, it creates an audience and gains attention. The providers of such applications can sell their customers’ attention as a product on a promotion market and generate revenue in doing so. At the same time, the providers collect personal, spatially referenced information about the users’ behaviour by logging their user habits. In this way, the providers of such applications can characterise the user behaviour quite accurately and with that increase the value of the application on the market. Hence, the user does not pay with money for using the application, but with his/her attention and private, spatially related information is monetised. The big players in this business, however, have started to charge the providers for the use of the underlying mapping services and related applications in a traditional manner.
Some Examples:
Apart from countless mash-ups, a new trend arises. Smart Maps - they include the possibility to do some adjusted visualisation as well as some (basic) analysis. Esri is pushing its GeoWeb-platform ArcGIS Online by presenting various forms of usage.
10.3 Spatial Enterprise IT
Similar to the disseminated use of spatial data in our private life, enterprises have started using the spatial components of their data as well. Based on an article from Steven Benner, from Esri, we will look into the development of GIS use in enterprises.
Companies have started to utilise the spatial part of their business data (e.g., customer addresses, store locations, supply chains) to improve efficiency and ease collaboration and decision processes. They want to use the spatial data within their existing software environment. This causes software companies to build “hybrid systems”, like SAP (HANA) and Oracle did. On the other hand, GEO-software companies like Esri or Caliper offer tailored packages for individual customers.
Let’s have a look at the key factors for spatial enterprise IT:
Spatial visualisation: The first step is to make data visible on a map, give them geographic context. Maps can show several layers of information at once which might lead to new insights and/or further questions.
Data access: Location can be the key to extract data from any company data structure. One building or shop has only 1 location - one can use this location to find the related information within all different systems. For example, Building Information Management (BIM) systems use location to combine data from different hierarchical levels and sources like accounting, technics, infrastructure, and customer contacts. In a way, the map is the user interface to access all data.
Taking action: The next step is to not only view and analyse data but to take action right on the map. Planning an appointment or a transport route from a supplier or to a customer is just one click away, and by seeing the location on the map - possibly on a satellite image - a visual verification happens as well, which will most likely save money and avoid costly mistakes.
Spatial analysis: More and more business systems integrate some form of spatial analysis into their portfolio. Spatial analysis is often used to optimise processes in managing infrastructure, marketing, or logistics (Figure 10.5).
Figure 10.5: An example of a spatial analysis.
10.4 Ubiquitous Computing and Sensor Networks
What was still a vision for the 21st Century (formulated by Weiser (1991)) at the beginning of the 1990s, is now reality in many approaches: The intelligent digital link between people, devices, and sensors in a network is today called ubiquitous computing. Unlike virtual reality, where attempts are made to truthfully replicate reality, virtual computers, computers, and sensors are a part of reality in ubiquitous computing. In this context, we often refer to the digital network of real things as The Internet of Things (Figure 10.6). The exchange of information within this network requires a connection between all the participating devices and persons on the internet and the definition of standardised interfaces and protocols to allow the communication.
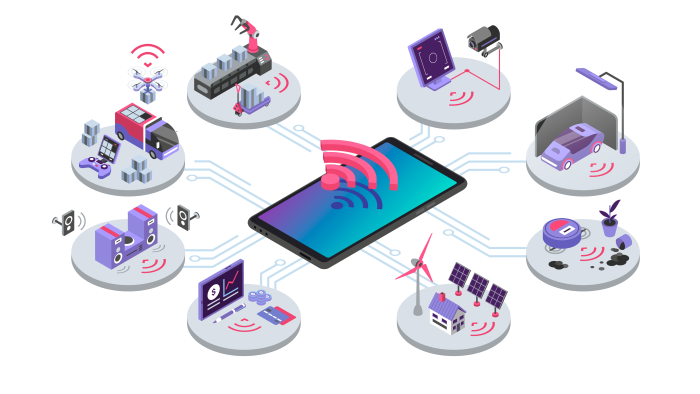
Figure 10.6: Internet of Things (Source: Adobe Stock).
One of the biggest unsolved challenges concerns the context of awareness of all devices and sensors. Similar to the human perception of space, every tool/thing needs to know where it is located and what its spatial relationship to the other objects in the network is. This is where the vast potential of tools and methods of Geoinformatics gains importance. Using GPS, RFID, or mobile telephone objects can be identified and localised and are, thus, put in a spatial context.
Interpreting the enormous amounts of data meaningfully, extracting information, and communicating it at the right time is not only a major technological challenge, but also a conceptual one. Regardless of the many serious social and ethical implications, this field within Geoinformatics is still expected to gain importance due to the numerous positive applications it can be used for.
An environmental sensor network comprises an array of sensor nodes and a communication system which allows their data to reach a server. The sensor nodes gather data autonomously and a data network is usually used to pass data to one or more base stations, which forward it to a Sensor Network Server (SNS). Some systems send commands to the nodes to fetch the data, while others allow the nodes to send data out autonomously.
Geo-sensor networks refer to data acquisition and (pre)processing with sensors that are distributed in space; recorded data are transferred to a server in real-time and are stored there. This system is particularly apt in monitoring environment properties such as surface temperature (Blaschke and Strobl 2010). Geo-sensors are a combination of micro-sensors (chemistry/biological), location devices (GPS), and communication (wireless). Each geo-sensor records the location, time, and the sensor value. Spatio-temporal methods are ideal for data collected by geo-sensor networks.
Geo-sensor networks - an example
An example of a geosensor network is the sensor-based Landslide Early Warning System (SLEWS) which is a flexible, cost-efficient, and reliable system that issues warnings about possible landslides. Here, the use of a wireless ad-hoc, multi-hop sensor-network combined with precise, low-cost micro-sensors resulted in an inexpensive and easy way to set up an intelligent monitoring system for gathering spatial data in large areas (Fernandez-Steeger et al. 2009). The application is based on Open Geospatial Consortium (OGC) guidelines for real-time monitoring, which is discussed further in the next chapter.
(The Open Geospatial Consortium (OGC) “is the home of geospatial innovation, collaboration, and standards. [It is] an international membership organization […] representing over 450 businesses, government agencies, research organizations, and universities driven to make geospatial (location) information FAIR: Findable, Accessible, Interoperable, and Reusable.” (OGC, 2024)).
Apart from passive sensor-data, there is a trend to active data acquisition via Unmanned Aerial Vehicle (UAVs) aka drones (Figure 10.7). Drones can be used for cost-efficient remote sensing, ranging from aerial images to laser scanning.
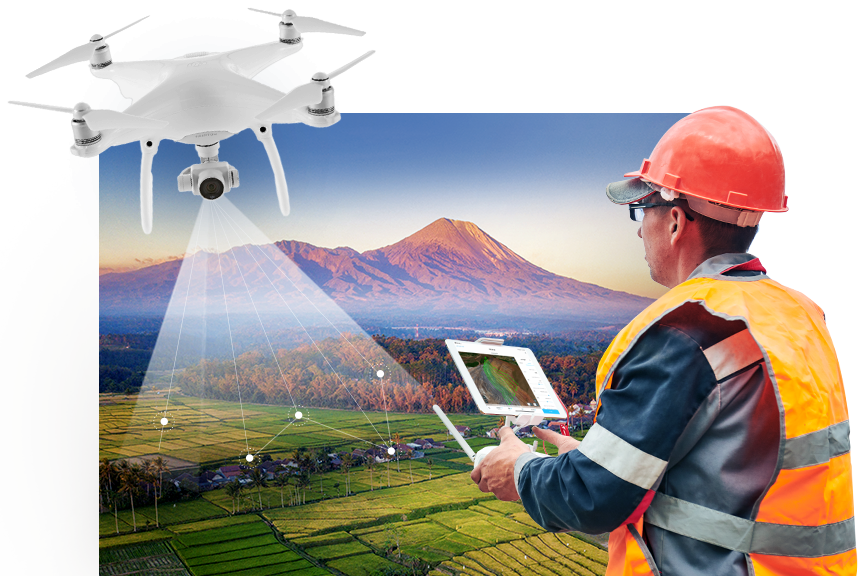
Figure 10.7: Unmanned Aerial Vehicle (UAV): Drone mapping in the field (Source: Esri UK).
To get an impression of how to create a 3D model of a house using a UAV watch the Video (8min) about 3D modelling.
Location is one of the keys to the IoT (Internet of Things). GNSS was the way to access positioning but new technologies are being brought in to enhance precision. Apart from WiFi, mainly Bluetooth and RFID are used to complement GNSS data. With the advent of 5G, IoT applications experience a new boost. Especially for Indoor Positioning and Navigation, these sensors gain importance as buildings are the “last unmapped places on earth” (next to the ocean ground).
Spatial data play an important role in many applications that - some years ago - sounded like science fiction:
- Smart cities
= digital urban infrastructure to increase efficiency of the energy consumption, traffic management, or supply infrastructure (Figure 10.8). You can watch the video Smart Cities Made Simple or this video on Smart Cities, to get an impression of what this can look like. Singapore took this even a step further with their Smart Nation Singapore project: Digital Twin of Singapore.
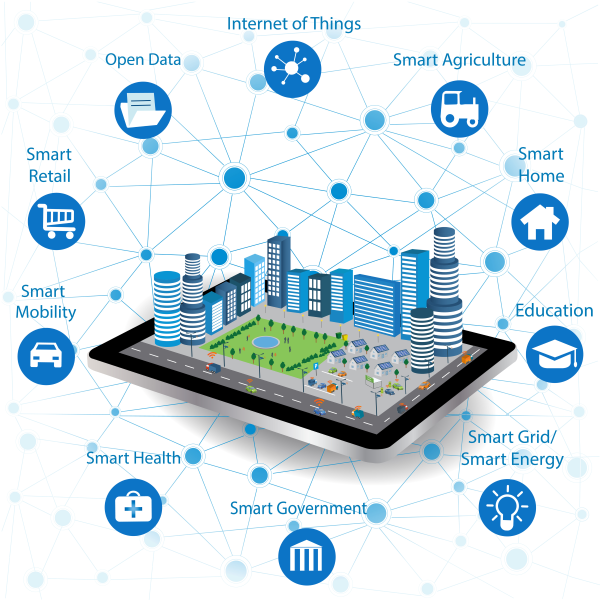
Figure 10.8: Smart city (Source: Adobe Stock).
- Smart homes
= domestic appliances (e.g., fridge, heating, energy supply) are connected to each other and to the outside to communicate with the homeowner (Figure 10.9) and to the smart city, to optimise, e.g., the supply infrastructure. See also: What is a Smart Home or Smart Building?
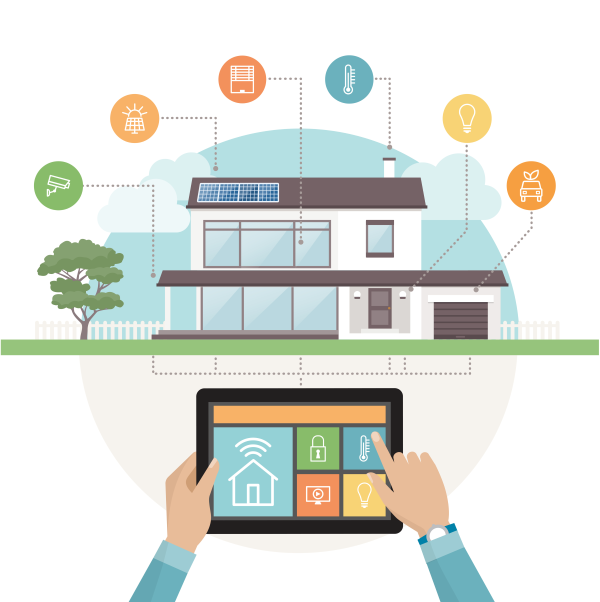
Figure 10.9: Smart home (Source: Adobe Stock).
- Autonomous cars
= require highly accurate sensors and positioning data to be fully aware of the environment while driving autonomously or driver-assisted (see also: SAE Automation Levels 1-5). This video explains from a more technical point of view how GIS supports autonomous driving: LiDAR use for autonomous vehicles.
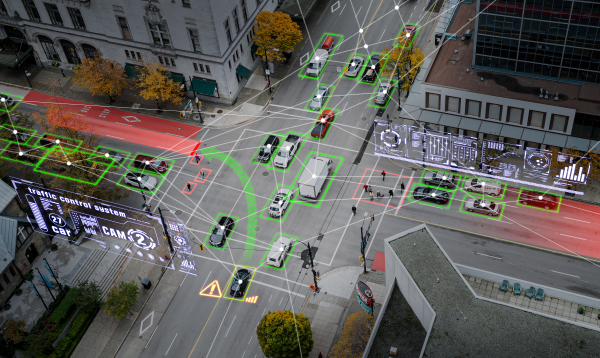
Figure 10.10: Autonomous cars (Source: Adobe Stock).
Further reading
These articles take you back to the roots of the technologies that are considered main-stream today:
10.5 Real-time
Real-time in this context is just an approximation: Due to capacity limits in data transmission and processing, there is always some kind of a shorter or longer delay. We, therefore, speak of near real-time. Building on the technical possibilities and the environment of ubiquitous computing, spatial real-time applications are becoming increasingly important.
Technically, a real-time GIS consists of the following components:
- determination of current location by mobile, Global Navigation Satellite System (GNSS), Radio Frequency Identification (RFID) or a similar technology
- continuously updated measurement data from sensor networks
- high bandwidth for data transmission
- high computing power for data processing
- defined interfaces for communication between different units
Unlike conventional spatial modelling which tries to simulate future situations based on data from the past, in a real-time GIS, data from the immediate present are processed, analysed, and displayed.
Real-time applications can be used effectively in a variety of domains:
- traffic control
- monitoring of environmental parameters
- management of disasters and huge events
- early warning systems
- location-based marketing
The benefits of real-time applications are obvious: With the availability of accurate images depicting reality, one can make better decisions in less time for a specific situation. Think of well-established applications such as pollution control and/or traffic load sensing, automatic speed limits on motorways or the display of the remaining time until the arrival of a public service vehicle.
The unfortunate example of the Love Parade disaster in Duisberg, emphasises the importance of knowing the magnitude of any situation involving a large number of people (Helbing and Mukerji 2012). Real-time GIS applications can provide security during such events and help with the management of visitors.
Read more about real-time data and data privacy
In such applications, the sources of data can be specialised measurement units (e.g., NOx measurement device, traffic counting device) and/or indirect sensors (e.g., active mobile devices). Despite a continued reaffirmation that these measurement devices and sensors generate only anonymised and aggregated data, frequent debates regarding the invasion of privacy and data protection take place - often with significant cultural differences. A quick Google search with keywords like “spatial data privacy europe usa” will quickly deliver further reading material on this global debate.
10.6 Artificial Intelligence
The term Artificial Intelligence was first used by John McCarthy at Dartmouth College, in 1955. His goal was to model abstract processes of human decision and learning processes in order to build machines that can process them. Drivers of AI development, nowadays, are research institutions, large companies in the military and security sector, and enterprises like IBM, Microsoft, Amazon, Google, or Facebook - mainly domains in need of processing vast amounts of data.
What is Artificial Intelligence, actually? Figure 10.11 shows the flowchart Karen Hao (2018) created for an article for the MIT Technology Review, summing it up to the point.
![Is it Artificial Intelligence? [@Hao2018].](images/ai-flowchart.png)
Figure 10.11: Is it Artificial Intelligence? (Hao 2018).
Most things called AI today, are actually Machine Learning and the sophisticated ones are Deep Learning. This includes algorithms from Amazon, Netflix, or Alexa as well as applications for biometric recognition, medical uses, the recognition of temporal patterns, or robotics. Basically, AI is about recognising dependencies, patterns, and regularities. An example: Humans “know” what a face looks like - it is in the front of the head, includes 2 eyes, 1 nose, 1 mouth …; therefore, there is no need to learn all faces by heart to recognise that an unknown person has a face.
If you are interested to dig deeper into the topic of AI, watch the Video 10.6 below.
Figure 10.12: Video (26min) Keynote from Karen Hao ‘What is AI?’.
In general, there are 3 kinds of machine learning:
- Supervised: Like a tracking dog, the algorithm learns and searches within a labelled dataset.
- Unsupervised: The algorithm tries to extract patterns and regularities within an unlabelled dataset.
- Reinforcement: Similar to a video game, the algorithm learns by trial-and-error and receiving rewards for predicting the ‘best’ next step.
For more details on different forms of learning read this blog article.
Today, one of the main aims for the use of AI is the reduction of unspecified noise and the extraction of relevant information. Spatial structures can provide additional alignment / ordering possibilities, as shown in Figure 10.13.

Figure 10.13: What can AI do for us?
Basically, these two pictures in Figure 10.13 show the same objects - sunbeds, umbrellas, water, sky, grey-brown underground, and palm trees. Just by briefly looking at it, humans can distinguish between the built-up (left) and the natural (right) scenery. Why? - Spatial context is defined by geometric features like size, shape, and positional relations. It simplifies the identification of single objects as well as groups of objects. GI-software can formalise these relations and features as well as add further layers to increase the analysis efficiency.
For further reading:
Below are four examples of AI applications in Geoinformatics that show the growing importance of AI within this field.
Example of AI in data acquisition
For many applications, a highly accurate reproduction of reality is needed. Due to the constant improvement of sensor technology, it is possible to create high resolution data. AI is used to process this vast amount of high-quality data as well as to extract relevant information and to eliminate noise.
The video 10.14 shows how HERE maps uses deep learning to improve their maps:
Figure 10.14: Video (1:54) Deep learning of road features from LiDAR by HERE Maps.
Further reading
- MapAI 2023 – Presentation Videos & Collaborative Results of the Pre-ICC Workshop on Cartography and AI at the ICA conference will give you an overview of current research in this area (ICA Commission on Geovisualization (icaci.org))
- Expanding Mapping Capabilities with Deep Learning
- “Maps Accurate to the Centimetre”
Example of AI in image analysis
Today the world is measured in great detail by satellites - creating highly accurate data. Neuronal networks and deep learning are already tools in use to process these remote sensing data. Video 10.15 provides insights into the use of AI in the analysis of satellite images:
Figure 10.15: Video (5:08) Interview with Einar BjØrgo Manager of UNOSAT.
As shown in Figure 10.16, Artificial Intelligence (AI) does a great job in the classification of land-use:
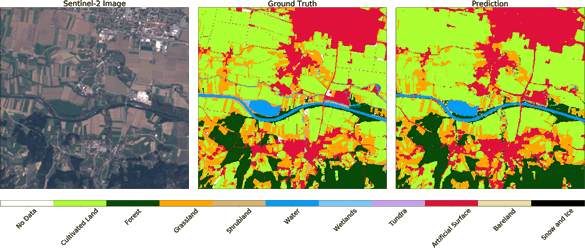
Figure 10.16: Land-cover classification by AI.
If you want to get detailed information on the contents of Figure 10.16, read this blog article.
Googling “geoAI overview” results in numerous informative articles on current developments in GeoAI, in different application areas as well as respective technological developments (see e.g., Esri’s An overview of the GeoAI toolbox).
Further reading
- Janga, B.; Asamani, G.P.; Sun, Z.; Cristea, N. A Review of Practical AI for Remote Sensing in Earth Sciences. Remote Sens. 2023, 15, 4112
- Explore the use of AI and data science for image analysis
- StoryMap on “GeoAI: Machine Learning & Deep Learning with GIS”
Example of AI in autonomous driving and traffic
Traffic situations are highly complex and cannot be fully covered by rules. This is why drones, image recognition, and artificial intelligence play an important role in creating the future of driving. By analysing data from different sources, the trajectories of various traffic participants can be predicted (Video 10.17).
Figure 10.17: Video (0:36) Detection of near accidents by DataFromSky.
Artificial Intelligence is essential for future full autonomous driving. Today, AI is already implemented in many cars, e.g., voice recognition or assisted driving. Autonomous cars are equipped with sensors, cameras, and communication systems that constantly create large amounts of data - without AI, processing these information items in “real-time” would be impossible.
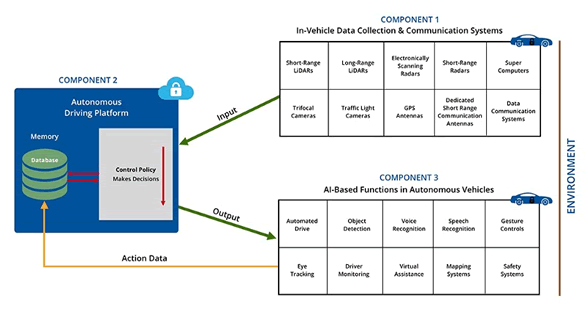
Figure 10.18: Components of AI in Autonomous Cars.
The full article to Figure 10.18 can be read here.
Further reading
- AI in Traffic Management
- Bird’s AI View: Harnessing Drones to Improve Traffic Flow
- Data from the Sky offers AI-solutions for the traffic sector
- Example for AI in autonomous vehicles
- Movement data and GIS
Example of AI in precision farming
The need for a more and more efficient agriculture is driven by an increase in food demand as well as restrictions in land and water supply. Research sponsored by Microsoft collected sensor data on farms in order to model precise predictions and give recommendations to farmers (Video 10.19).
Figure 10.19: Video (1:54) FarmBeats tracks soil moisture data 24/7.
More about this Project can be found here.
10.7 Cloud GIS
The outsourcing of IT infrastructure, platforms, and software on the internet, collectively referred to as cloud computing, is a trend that has existed for several years and is used in many applications on a daily basis, such as email services or photo- and video platforms (Figure 10.20).
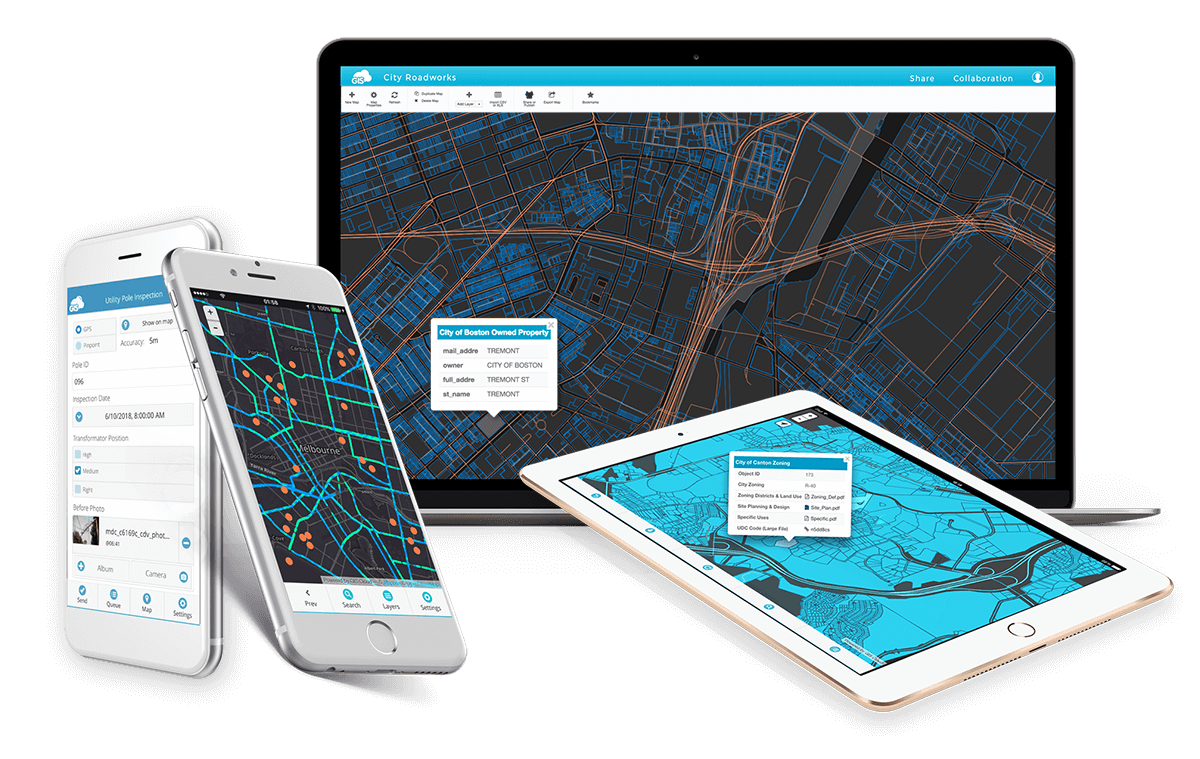
Figure 10.20: Mapping and viewing applications on multiple devices are connected through a server infrastructure that - together - build a Cloud GIS.
Despite the already extensive application of cloud computing, its full potential in the development of more applications has not yet been achieved (or even thought of).
While the technology of cloud computing is not new, the tremendous computing power and availability of adequate bandwidth for data transmission has resulted in a new business model: One in which everything, ranging from a simple application to a complete IT infrastructure, can be offered by or outsourced to service providers in the cloud (e.g., Amazon). One must only pay for the performance (pay-as-you-go). Known applications that implement cloud computing are Google Docs, Microsoft Office Online, Flickr, Dropbox, and various webmail services.
Traditionally, desktop and client-server architecture are used in GIS. However, the implementation of cloud-computing in GIS has almost replaced those models and made them obsolete. While a client-server architecture requires every organisational unit to operate and maintain its own server infrastructure and software, cloud computing establishes and provides a more customised approach, wherein functionality can be delegated to different servers in the cloud.
Most GIS users can clearly notice the availability of many GIS applications online (for example, ArcGIS Online uses a web browser). This means that a software program does not need to be locally installed for storage, analysis, and visualisation of spatial data. Instead, all one needs is a web browser and sufficient bandwidth. Cloud computing allows providers to outsource their spatial data and apps via web-services over the cloud. This allows them to save fixed costs and avoid network capacity bottlenecks. For example, the Swiss spatial data viewer map.geo.admin is outsourced to the Amazon cloud. Due to the scalability of the infrastructure, services are offered without delay even during heavy traffic (see Figure 10.21).
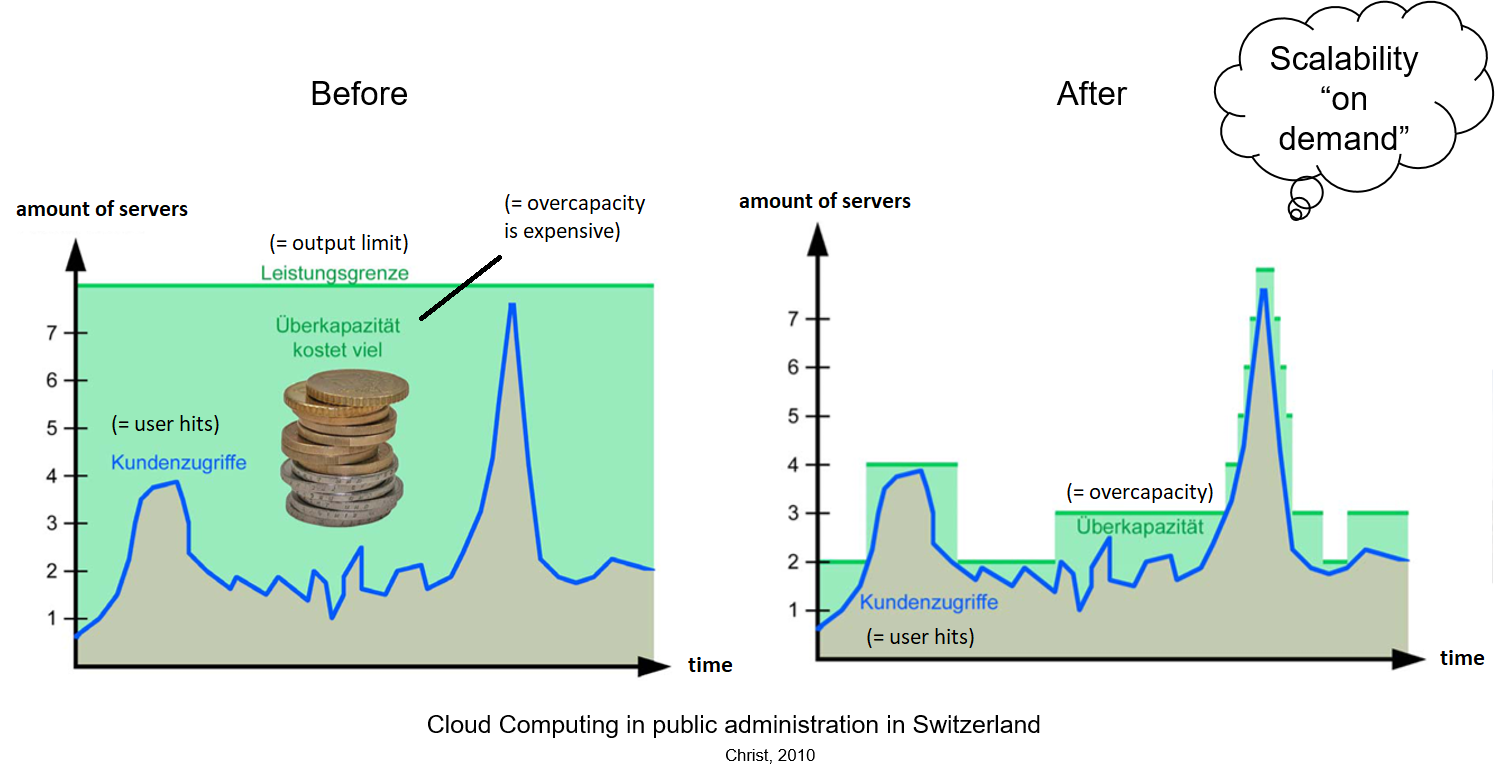
Figure 10.21: The pay-as-you-go model (modified, i.e. translated, after Christ, 2010: Cloud computing in public administration in Switzerland).
Cloud GIS provides endless possibilities and holds tremendous potential. However, it also brings forth a few problems that need to be solved:
Privacy, locality, and assignability of data in the cloud are major problems. There are also few risks (such as risk of lock-in) involved in transferring data to an alternate cloud provider. Because of this, authorities often hesitate to rely completely on services via cloud GIS.
Licencing and infrastructure costs for GI systems are typically high. GIS services offered on the cloud are economically feasible options as one only has to pay for the performance of the service. This is particularly useful for small businesses that only use GIS occasionally and with that only have to pay for actual usage.
GIS providers who are delivering resource intensive services with high usage fluctuations could choose flexible GIS cloud extensions, without having to expand their own IT infrastructure.
For further reading:
- Spheres of cloud computing
- How Cloud Computing Works
- ArcGIS Online
- Global Cloud GIS Industry Research Report 2023
To get a more technical but still informative input on ArcGIS and its capabilities to share items across an organization, you can watch video 10.22 below:
Figure 10.22: Video (31:06): ArcGIS–GIS and Mapping & Location Platform. Jack Dangermond Keynote at Esri UC 2018.
10.8 Open-Source Software and Open Data
The term “open-source software” (OSS) summarises a wide variety of licencing options. Common to all these options is the disclosure of the source code and the possibility for a further development.
OSS and free data per se are nothing really new. What is new is that more and more companies and government agencies build their entire GI infrastructure on OSS and/or provide any officially collected data on the internet free of charge.
Since the licensing of the open operating system Linux 25 years ago, open-source software has matured to a serious alternative to commercial products. In GIS applications, this development first took place in the (map)server and in database infrastructure. Based on this, desktop GIS software has matured to such a degree that they are now suitable for everyday use due to, e.g., ease of use, stability, or functionality.
More and more agencies and private sector companies hope that through the use of open-source GI software the saving and innovation potential will grow.
The advantages of the use of OS products are obvious:
- Shorter innovation cycles through an on-going development while the OS product itself remains available
- Direct communication with developers and users through web forums and community meetings
- Distributed development costs
- No licencing fees
- Scalability and flexibility provided by open-source code; the products can be customised to your needs (if you have or can afford the necessary skills to do so)
- Platform independence: OS software is, usually, designed for any operating system
The current shortcomings of the otherwise widespread use of OS GI-Software are:
- Migration costs incurred when moving from one software platform to another
- Uncertainties regarding support and stability
- Existing long-term contract obligations
- Comparably higher trust in established software providers
The more cultural reservations about open-source software are sometimes attributed to the self-understanding of the provider(s): Commercial vendors sell a finished product, whereas the use of open-source software often implies participation in an on-going project.
Currently, it is mainly larger companies or authorities, and one-person companies that use OS GI-software for different reasons. With acceptably stable applications, this trend will continue in the future and find its way into a wide variety of GIS applications. In order to use OS GI-software successfully, a fundamental openness to the open-source idea and basic GIS and/or programming are necessary.
The term open data refers to the availability of cost-free, transparent data, which is closely associated with the idea of OSS.
What was common practice in the U.S., long ago, now seems to be working well in Europe. In this regard, Great Britain has become the driving motor in making government data open. This commitment is emphasised by political support at the ministerial level, a condition that seems essential for the effective implementation of the idea of open data.
The economic benefits of an increased economic activity in the GIS sector through the provision of free geospatial data is greater due to the increased reflux in taxes than those collected through - in part - substantial licence and usage fees. These fees can be so high that it makes applications simply not affordable. In addition, socio-political issues such as the increased transparency and accessibility are put forward, which should lead to greater democracy and citizen participation.
Some states, cities, and authorities have already succeeded in turning the idea of open data into practice, which has led to a high number of innovative applications, for example the locations of the subway trains in London. The website World Map of Open Government Data Initiatives tracks open governmental data (OGD) initiatives worldwide, see Figure 10.23.
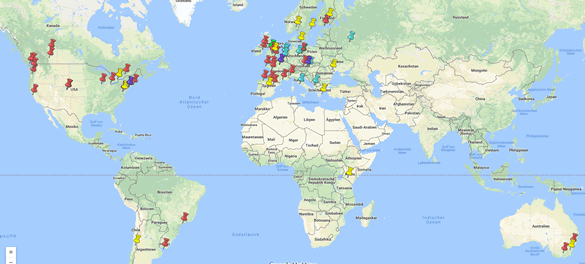
Figure 10.23: OGD Initiatives.
For further reading:
Open-Source GIS software examples:
Click here for Open Jump (Figure 10.24).
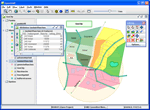
Figure 10.24: Open Jump
Click here for QGIS (Figure 10.25).
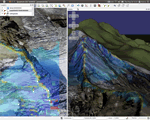
Figure 10.25: QGIS
Click here for gvSIG (Figure 10.26).
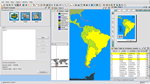
Figure 10.26: gvSIG
10.9 Multidimensional Modelling (3D, BIM) and Simulation
Although much research and development exist in the field of 3D and space-time modelling, applied GIS concepts mostly only consider two spatial dimensions. The analogy to the two-dimensional map still has a very strong impact on digital, spatial modelling.
While real three-dimensional geometries such as mines, caves, interiors etc. can now be adequately modelled and mapped in GIS, an analytical 3D functionality is a scarce commodity. Reasons for this still lie in conceptual ambiguities (e.g., how to apply a classical GIS function of an overlay in a 3-dimensional model) and limitations with respect to data availability and computing power.
The integration of time as an additional dimension is an additional challenge for most GI systems. Many, often basic, aspects related to spatio-temporal modelling are still not clarified; an appropriate digital representation of the relationship between space and time is one of them.
The use of GIS, simulation models (e.g., Figure 10.27), and three-dimensional visualisations in research and projects is not new. The integration of these three technologies into one application results in a powerful tool for decision-making and planning.
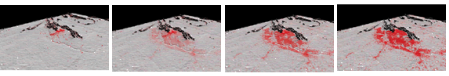
Figure 10.27: Settlement Growth.
Figure 10.28: A simulation of a wet-snow avalanche.
Notwithstanding the conceptual challenges that still exist, especially, in the field of visualisation and simulation as well as in analysis, the third spatial dimension and the time are taken into account. This, in turn, increases clarity. While the spatial and temporal dimension were, until recently, considered separately for modelling and analysis, a combination of the four dimensions is now frequently observed in both the simulation, as well as in the GIS area. An example is the simulation of a wet snow avalanche, shown in Figure 10.28.
Extensive simulation tools such as PowerSim hardly touched upon the spatial context, whereas GI-Systems considered time as a static property of a geometry at most. Both worlds, however, have been showing some change.
What began with simple “3D walks” and fly-overs has developed into tools for innovative urban and landscape design (Figure 10.30). This involves, for example, the simulation of disasters, such as floods or mudslides, the spread of pollutants, or the impact of construction on the landscape. Three-dimensional displays are suitable for both analytical problems (solar potential, and visibility analysis), as well as to effectively communicate complex projects. Here, it is important to note that not only the visualisation is in the foreground, but is also considered more frequently in data collection, modelling, and analysis of the third spatial dimension. For example, the latest three-dimensional representation of cities by Google Street View was found to be an ideal tourism and advertising platform. During recent years, 3D and GIS also had a lasting impact on building innovation models, i.e. BIM. Watch the video below to get an impression of how GIS and BIM can be used:
Figure 10.29: Video (01:04:10): BIM and GIS an Introduction. Esri UC 2019.
For further reading:
- Sina Karimi and Ivanka Iordanova (Karimi and Iordanova 2021) from the Montreal Institute of Technology (Canada), examined the scientific literature on the integration of GIS and BIM in a study published in 2021. Take a look at this article if you have enough time and interest!
- If you want to get hands-on experience, take a look at the learning path BIM and GIS.
Figure 10.30: Augmented Reality.
Closely related to the multi-dimensional modelling and simulation is the establishment of augmented reality applications. In real-time, three-dimensional space is enriched with digital information. Through this blending of the physical and virtual space, one can easily develop highly informative applications. “The next big thing?” is the question of an article from 2017, discussing possibilities for GIS Applications with AR and VR.
For further reading:
10.10 The Future of GIS
Given the widespread availability of user-friendly web applications for geospatial data analysis and visualisation, the need for specialised GIS-developers and practitioners is obviously an important question at the beginning of your UNIGIS-studies. The question: “Can I attach a value to everything I have learned?” may currently be in any case answered with: “Yes”!
There are several reasons why:
- The GI-industry remains an emerging field, as technological and societal trends are heavily shaped by digitalisation. This is closely linked to the potential to generate added value for numerous processes and analyses through a spatial perspective. Competence in using GIS, as well as the ability to integrate different applications domains and methodological approaches based on geographic coordinates, will continue to be in high demand in the future (see the Geospatial Technology Competency Model or growth of GIS market size).
- The spatial dimension supports the integration of data from a wide variety of sensors and domains. Whether it involves sensor networks in a smart city, the aggregation of data sources in a dashboard, or the overlay of the physical world with a virtual layer: the spatial reference – or in other words, the spatial relationships between elements - is used as a common denominator.
- The larger the scale of GI-technology, the greater the need for experts: GIS not only enhances the efficiency of public services but also compels an increasing number of employees to work with geospatial data in compliance with legal requirements, such as the mandatory implementation of the INSPIRE Directive. Furthermore, the private sector has discovered the added value of Geoinformatics, be it a tool for their own area of expertise or as a foundation for new, innovative business models.
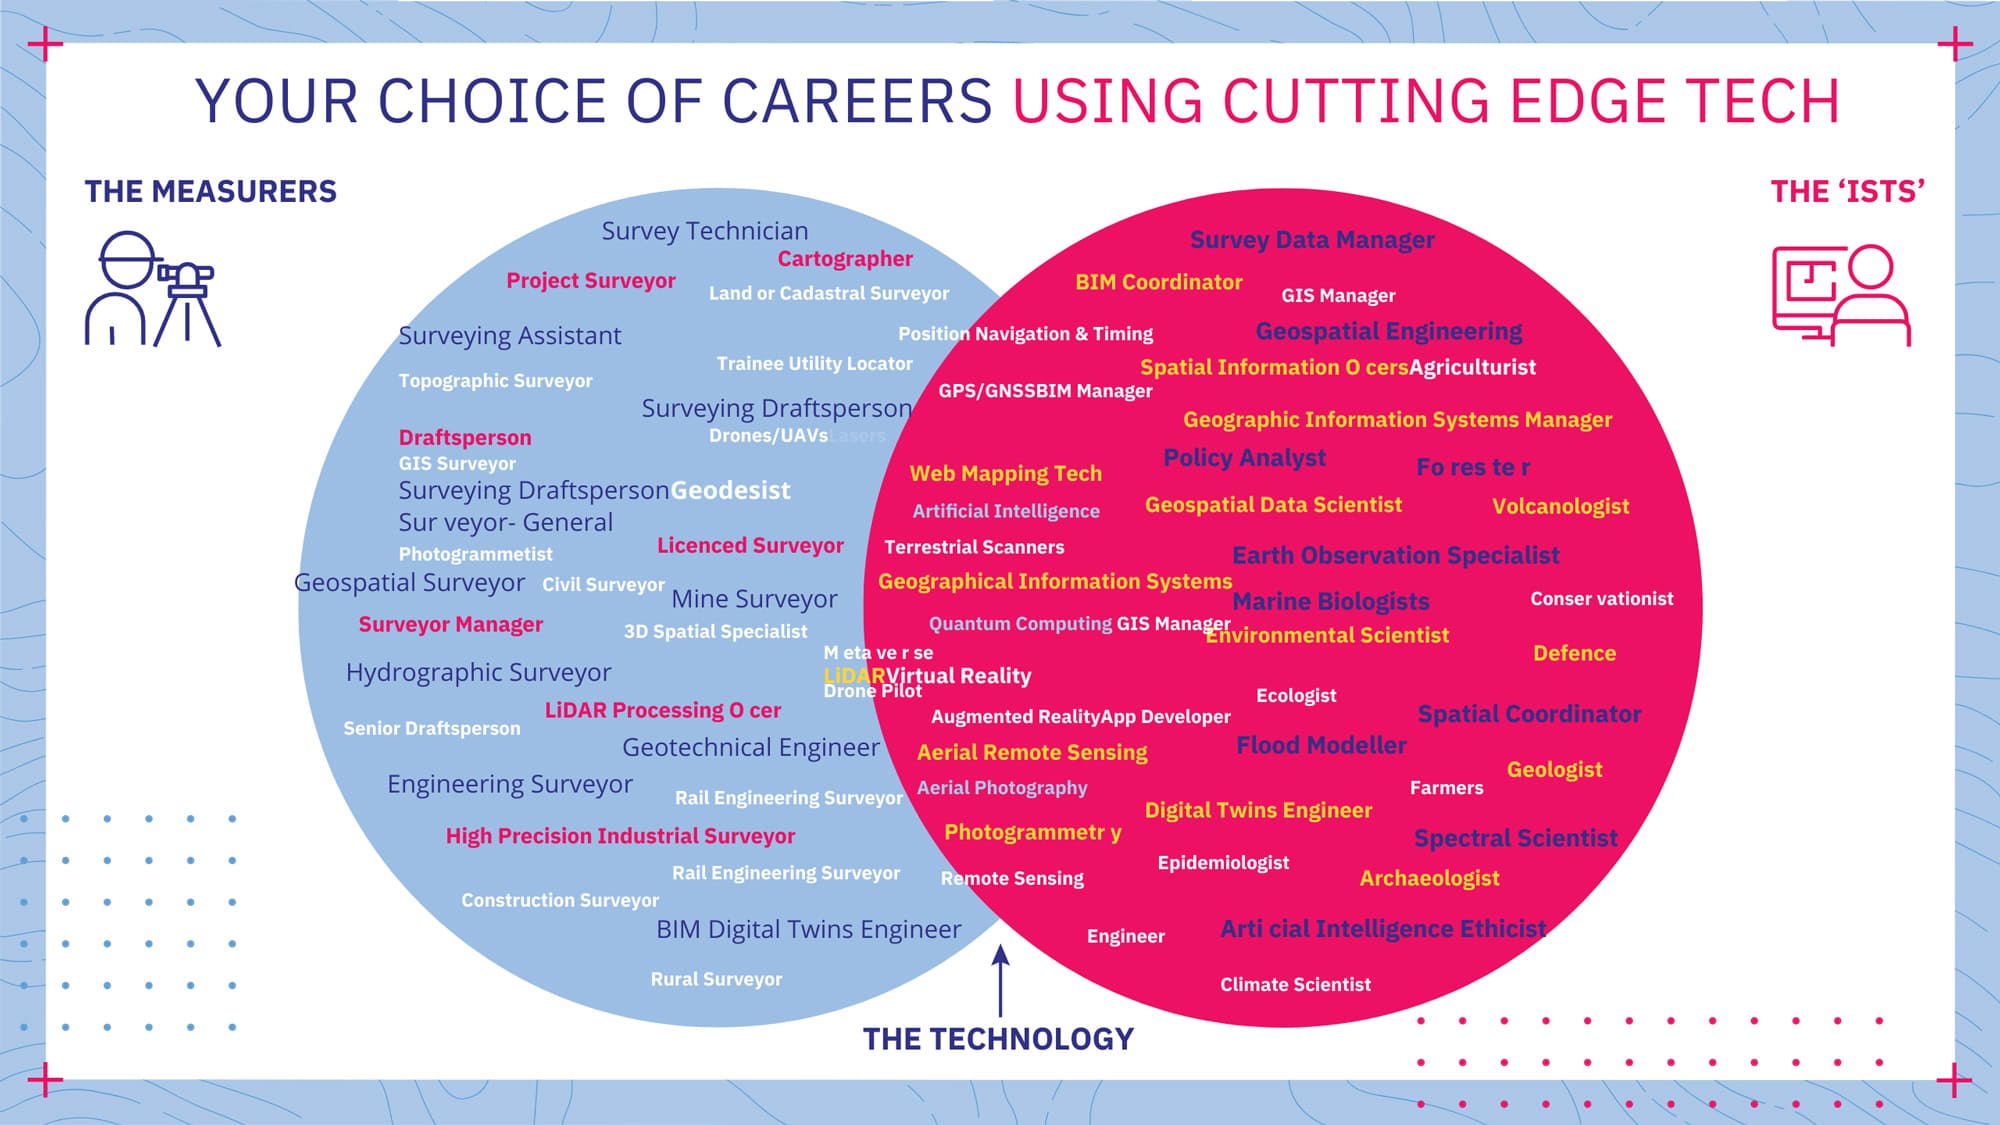
Figure 10.31: Geoinformatics and career opportunities (source: Geospatial Council of Australia).
The diversity of application domains and the widespread use of geoinformation technologies across numerous economic sectors provide a broad range of career opportunities for you as a UNIGIS student. While just a few years ago creating digital maps was often sufficient for a GIS professional, today’s job market demands a significantly more complex and specialised skill set, including the integration of diverse data sources, working with 3D and real-time data, and the application of AI-supported analytical methods.
A solid foundation in the fundamental concepts and methods of Geographic Information Systems is essential for effectively acquiring and applying these specialised skills. Hence, the upcoming modules in the UNIGIS program will focus on these core concepts and methods, providing a solid basis for your further personal specialisation.