Lesson 10 Current Trends in Geoinformatics
10.1 Introduction
Due to ever shorter innovation cycles and enormous advances in all areas relevant to GIS, describing trends in Geoinformatics is a rather risky undertaking. Even as these lines are being written, they are already in danger of being outdated. New ideas and applications appear at a rapid pace, while supposed trends burn up like shooting stars on the (GI-)horizon. In this highly dynamic environment, technological developments have emerged over the past 10–15 years that fundamentally define the framework for innovations in Geoinformatics. Without going into detail at this point, the following parameters should be mentioned:
- increasing computing power
- miniaturisation of sensors
- increasing volume, availability, and accessibility of data
- diversity and progress in software development
- rapidly accelerating development cycles in artificial intelligence (AI)
- growth in the size of the GIS community.
These developments are overlaid by two megatrends that extend far beyond the field of Geoinformatics. On the one hand, society is being fundamentally changed through the process of digitalisation: some refer to this, especially with regard to transformations in the industrial sector, as the “fourth industrial revolution” (Industry 4.0). On the other hand, various crises (above all the climate crisis) are forcing societies to adopt a different, more sustainable way of living. The sustainability goals formulated by the United Nations (SDGs) are in many ways becoming the benchmark for politics, economic activity, and social coexistence. The immediate spatial reference of most sustainability goals gives Geoinformatics a key role, as illustrated by the following map application (Figure 10.1):
Figure 10.1: In the Hunger Map of the United Nations World Food Programme, all relevant information is presented directly in a map-based format.
If you want to learn more about the contribution of Geoinformatics to the UN SDGs, please refer to this special issue (open access) of the International Journal of Geo-Information.
Despite some early predictions of the end of Geoinformatics, modelling and analysing spatial data has proven to be a fundamental pillar of the digital society we live in. More than ever, GIS specialists as well as experts with GIS-expertise across different application domains are in high demand. Moreover, the ability to understand and apply geographic concepts and methods - referred to as “spatial literacy” (cf. Bednarz and Kemp (2011)) - is emerging as a key competence in a rapidly growing job market.
In 2020, the United Nations initiative Global Geospatial Information Management (UN GGIM) published the third, updated version of future trends in geospatial information management for the coming years. For anyone interested in the various trends and a detailed analysis of them, please have a look at this document:
UN GGIM (2020), Future trends in geospatial information management: the five to ten year vision.
Three leading figures in the field of Geoinformatics, who have been or still are affiliated with UC Santa Barbara (USA) - Trisalyn Nelson, Jack Dangermond, and Mike Goodchild - also provide interesting insights into the future of the discipline. In March 2021, they shared their assessments in a webinar, which can be viewed in Figure 10.2 :
Figure 10.2: Video (1hr35min): Webinar on Emerging Trends in GIS.
In addition to these comprehensive resources, numerous online contributions provide assessments of where the field of Geoinformatics may be headed in the future:
- Forbes foresees the boundless future of geospatial data and offers innovative ways of their use in industry and government.
- Geospatial World Technology Trends for 2024.
- Key Trends in Geospatia Techology 2025 by GeoAwsome.
- Geo Week News - Predictions for Geospatial Specialists.
The forecasts from the IT industry are also of interest. Many of the trends mentioned have a direct impact on the field of Geoinformatics:
Throughout this lesson, you will quickly realise that “GIS” is not merely an established method or tool, but a highly dynamic environment with far-reaching implications from professional practice and the everyday use of Geotechnologies to broader societal processes. Have fun!
Upon completion of this lesson, you should be able to:
- Discuss the current and dynamic development of GIS
- Predict and suggest possible future roles of geospatial information
- More effectively set priorities in your own work with GIS
In this lesson, we will address the following topics:
- GeoWeb and the Growth of the Geoinformatics Community – The spatial dimension on the Internet is driving ever-new, innovative applications and business models.
- Spatial Enterprise IT – Business processes are increasingly being established within a geographic framework.
- Sensors and Data – Location, measurement, and communication technologies continuously collect and transfer data about the current state of our “environment” in the broadest sense. Increasing resolution, connectivity, and real-time processing are the key trends.
- Artificial Intelligence – To extract relevant information from the vast amounts of data, so-called “artificial intelligence” plays an important role.
- Scalability and Cloud Computing – Moving infrastructure, software, and data to the cloud.
- Open Source Software & Open Data – Using GIS software without license costs and accessing free government data available online. These trends promise exciting applications!
- Digital Twins – From information models to an ecosystem of applications and functionalities.
- The Future of GIS – More than maps: data intelligence across space and time.
10.2 GeoWeb and the Growth of the Geoinformatics Community
Various technological developments around 2010 paved the way for the emergence of a spatially organised “online ecosystem” known as the “Geospatial Web” or “GeoWeb” for short. The GeoWeb is less a technology than a collective term for new usage patterns that enable the spatial organisation of information, services and applications on the Internet. The prerequisites for the GeoWeb to become a ubiquitous companion in our everyday lives can be summarised simply: mobile devices with inexpensive location and other physical sensors as well as high computing power, permanent connection to the Internet, scalable infrastructures in the cloud and simple, seemingly free applications (apps).
In the early days of geobrowsers such as Google Earth and Google Maps, the distinction between the Web and the GeoWeb was relatively clear. Today, this distinction has largely disappeared. User location has become an inherent part of web data, and spatial information and services are now standard features of modern web technologies. For example, when opening Google Maps, the map automatically centers on your location using your IP address or device location data.
In parallel, recent years have witnessed a rapid expansion of social media platforms, generating vast volumes of data. A considerable proportion of this data contains either a direct spatial reference (e.g., location as part of user metadata) or an indirect one (e.g., place names mentioned within textual content). Consequently, such data will continue to constitute a significant driving force behind the ongoing evolution of the GeoWeb.
The increasing integration of spatial information, services, and business models into the Internet now enables virtually any user to become part of a growing GIS community. In this context, the distinction between providers and consumers is becoming increasingly blurred: a phenomenon often described using the term “prosumers”. The voluntary contribution of spatial datasets by non-experts is referred to as Volunteered Geographic Information (VGI), with OpenStreetMap being one of the most prominent examples.
Due to the ease of map creation and the popularity of location-based mobile applications, more geodata and more maps are currently being generated than ever before. In most cases, however, these are not produced by GIS-specialists. Owing to the extensive availability of application programming interfaces (APIs) and software development kits (SDKs), web-savvy users can easily integrate GIS functionalities into their own applications (e.g., MapHub). These tools differ in terms of complexity and the level of expertise required. In the simplest cases, a map merely serves as contextual support for organising spatial information. This “layering concept”, which we encounter in countless dashboards, infographics, and online applications, is commonly referred to as a mashup.
The (screenshot of the) map application in Figure 10.3 illustrates such an example: point-based spatial information is referenced to a base map. This allows spatial characteristics and relationships (e.g., the locations of museums) to be visually (implicitly) identified, or the data to be spatially analysed (e.g., through density calculations) and described.
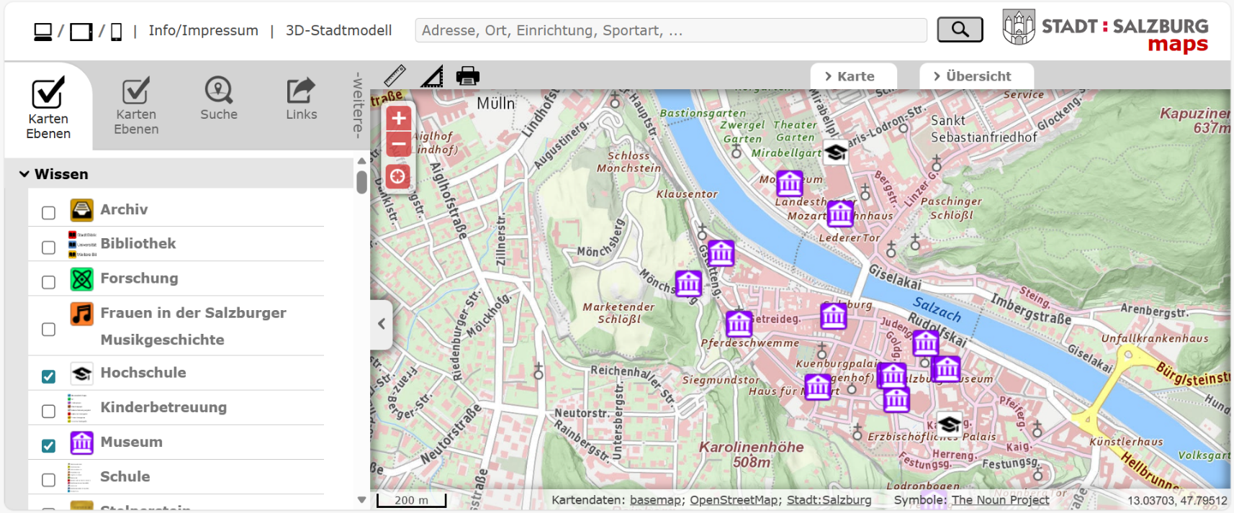
Figure 10.3: This is an example of a map mashup. Visit the online STADT:SALZBURG map. We – on purpose ;-) – want to give a local example from Salzburg and that’s a good opportunity for our students to practice their German.
As in the locations of the museums shown in Figure 10.3, any data with a spatial reference can be displayed in web mapping applications. It does not matter whether the data consists of photos (e.g., from Flickr), hotel locations (e.g., on booking platforms like Booking.com or Tripadvisor), or data from government agencies, statistical offices, and international organisations. When such a dataset is assigned a spatial coordinate, this process is called geo-tagging.
In addition to the countless mashup maps and applications, a trend is currently emerging toward so-called smart maps (intelligent maps). In this approach, when data is loaded, an appropriate visualisation type is suggested based on an immediate analysis of the data (Figure 10.4). The resulting maps go far beyond simply displaying the data with point symbols. Typical visualisation types in these intelligent maps include heat maps or proportional symbol maps.
Figure 10.4: Example of a smart map: public restrooms in Vienna (OGD data) displayed in ArcGIS Online.
This trend for creating smart maps with analysis functions is strongly related to the increasing integration of GIS functionalities into web technologies. ESRI’s ArcGIS online is an example of this trend. Such online platforms provide non-experts excellent possibilities to visualise, explore and analyse data.
10.3 Spatial Enterprise IT
Similar to the growing prevalence of GIS components in the consumer and user sectors, spatial information - more broadly referred to as location or spatial intelligence - is playing an increasingly important role in business applications. The reason is clear: companies, whether they realise it or not, are sitting on vast geodata resources, including customer addresses, location data, supplier networks, and much more.
At the same time, entire industries and value chains are undergoing a transformation, often referred to as the Fourth Industrial Revolution or Industry 4.0. As processes are radically digitised and data is transmitted across all scales (from global supply chains to fully automated production lines) unimaginable amounts of (location) data are generated, which can no longer be processed or analysed using conventional methods. Leveraging these (spatial) data streams for business advantage is the goal of integrating GIS into enterprise IT.
According to a 2020 article in the business magazine Forbes, more than half of all companies consider location intelligence very important or important for achieving their business objectives. In government agencies and public administrations, this proportion rises to as much as 90%.
Compared to some earlier applications, standalone GIS software is now rarely used in the enterprise sector. Instead, GIS functionalities are integrated into existing systems. This results in hybrid applications that, on the one hand, support business processes and, on the other, can directly store and process spatial information. Numerous examples of these integrated solutions exist. Well-known enterprise IT providers that offer GIS functionalities include SAP and Oracle.
At the same time, the trend among GIS software vendors is increasingly toward providing tailored, complete systems for clients. These systems cover the entire process chain, from data collection to the visualisation of results (vertical integration), while also supporting the connection of different information systems (horizontal integration). ESRI and Caliper are examples of vendors offering such solutions.
But why should companies outside GIS-focused domains actually consider integrating spatial information into their systems? Following the points made by Matthew Lewin in his eBook Geospatial Strategy Essentials for Managers, particular attention should be paid to the following aspects:
- Unlocking new value creation opportunities
- Supporting digitalisation strategies
- Improving the user experience
- Establishing a shared data foundation
Let us briefly examine each of these aspects and illustrate them with example cases.
10.3.1 Unlocking New Value Opportunities
Creating value is naturally a core focus for any company. Companies offer products and services to provide customers with added value, which can then translate into profit. Understanding the value of spatial information opens up new opportunities to create value by asking the “where?” question. Often, this potential only becomes clear when problems are looked at as spatial problems.
Here is an example: In a village in the Austrian Alps, a mudslide occurred after heavy rainfall, damaging many houses in the settlement (Figure 10.5). Homeowners, landowners, and road maintainers submitted their claims to an insurance company. Due to the large total amount of damage and the high number of claims to process, the insurance company took a long time to handle the cases. As a result, the insurance customers had to wait a long time for their payouts.
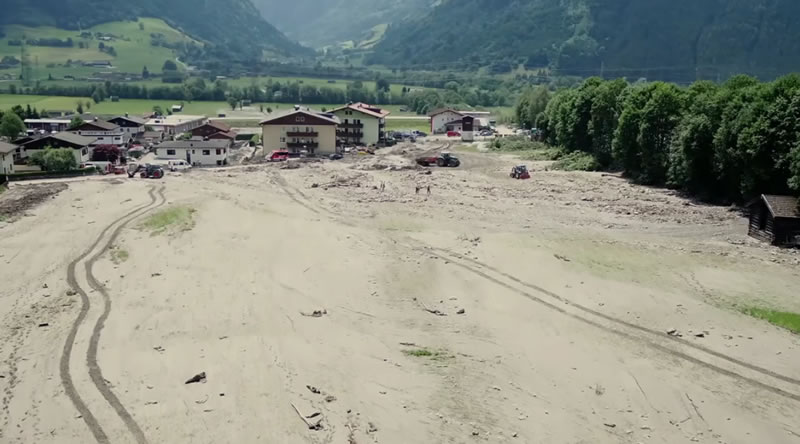
Figure 10.5: Heavy mud buildup following a mudslide.
What happens when this situation is reformulated as a spatial problem?
The insurance company flies the area with drones and analyses the imagery using AI-powered tools (e.g. Figure 10.6). This allows the extent of the damage to be assessed very quickly. By overlaying the results with cadastral data, the affected property owners can be identified. Based on this information, the plausibility of the claims can be quickly verified, and initial payouts can be processed.
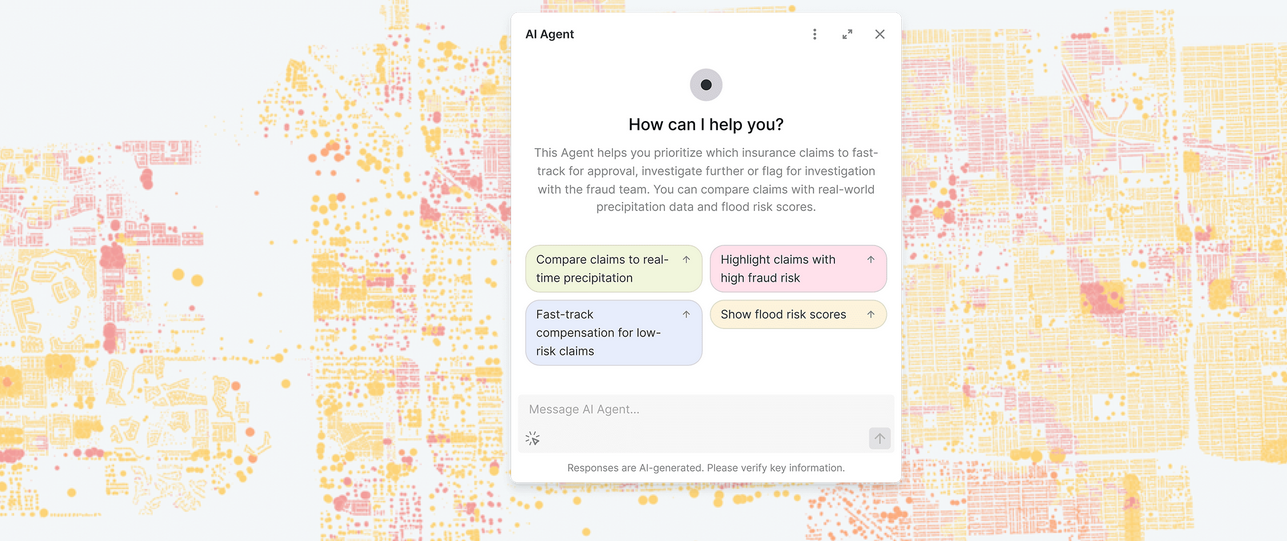
Figure 10.6: AI agents can assist in prioritising insurance claims, thereby positively impacting the value chain of insurance companies (for example the CARTO AI Agent.
For sure, this example is simplified. However, it illustrates the potential of spatial information to unlock additional value creation: the insurance company was able to process the cases much faster than usual, and the affected individuals had to wait less time for their payouts.
10.3.2 Supporting Digitalisation Strategies
Digital technologies and new business models are currently transforming entire industries. Companies are therefore forced to respond and develop their own digitalisation strategies. This trend was further accelerated by the COVID-19 pandemic (DMEXCO study). However, having a digitalisation strategy does not automatically lead to greater business success. According to a 2022 McKinsey study, 90% of surveyed companies reported having a digitalisation strategy, yet only a minority achieved measurable success
A key success factor for digitalisation strategies is processing the additionally generated data in a profitable way. Simply producing and collecting data initially creates extra effort without immediate benefit. The challenge, therefore, is to derive relevant information from the data, which can then lead to insights and be translated into innovations. This is precisely where geoinformatics can make a significant contribution: since most data has a direct or indirect spatial reference, having the right tools and expertise is crucial to creating added value for the company.
Here is an example: As part of a digitalisation initiative, an electricity provider begins equipping its customers with so-called smart meters. This allows the company to gain a daily overview of electricity consumption and better control over its network. Integrating GIS functionalities into its digital business application helps identify which households are best suited for the initial rollout of smart meters. At the same time, the energy provider can immediately calculate which travel routes (and thus costs) can be saved when reading the meters. In operational management (Figure 10.7), a dashboard that links the supply infrastructure with smart meter data and other relevant business figures enables ongoing system monitoring and optimisation.
Figure 10.7: Smart meters provide a real-time overview of electricity consumption.
Hence, by integrating spatial information into its digitalisation activities, the company can create added value that ultimately also makes economic sense.
10.3.3 Improving User Experience
Nowadays, competition among service and product providers is largely determined by customer experience. Providing a positive user experience leads to higher customer satisfaction and, consequently, directly contributes to business success. When companies understand the context in which their customers find themselves and adapt their products and services accordingly, the likelihood of long-term customer loyalty is very high.

This is where geoinformatics comes into play. By knowing a user’s location, companies can gain valuable insights into their situation: from current weather conditions and public transport departure times at the nearest stop, to nearby shopping options, leisure activities, and even the expected delivery time of a parcel. When such information enhances customer interaction and improves the user experience, spatial information becomes a significant competitive advantage.
Here is an example: A supermarket chain receives excellent reviews on online platforms. Unfortunately, these high ratings do not translate into sufficient sales. Why might this be the case? To answer this question, a digital map of the store’s layout is created.
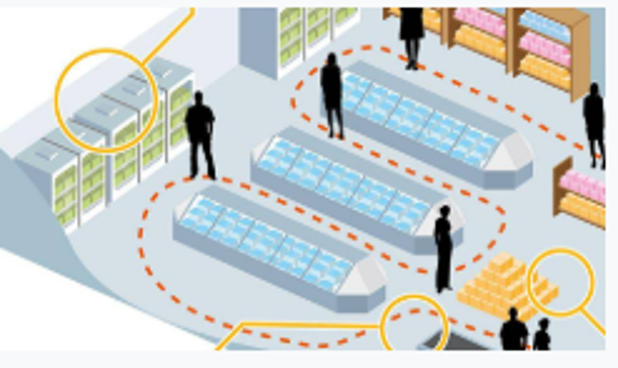
In addition, visitor flows are tracked using Bluetooth and RFID-beacons. Based on this data, the movement of customers through the store can be analysed. This provides the foundation for optimising store layout and product placement. The current position of customers can also enhance the immediate shopping experience: for example, an app can provide additional information (allergens, origin of products, recipes, etc.) or guide customers to the items they are looking for.
10.4 Sensors and Data
The tremendous reduction in the cost of sensor technology has led in recent years to a veritable flood of data, which will continue to grow both quantitatively and qualitatively in the coming years. Consider, for example, your smartphone, which you purchased for just a few hundred euros or perhaps even received free of charge with your mobile phone contract. With it, you carry sensors in your pocket that only a few specialists had access to just a few years ago.
In addition to mobile devices, it is especially “smart devices” that serve as sensors and contribute to an increasingly precise digital representation of reality. What Mark Weiser formulated in the early 1990s as a vision for the 21st century has, in many respects, already become reality: the intelligent digital connection of people and devices linked together as sensors. This highly dynamic network with a multitude of nodes is referred to as the Internet of Things (IoT) (Figure 10.8). What for some is a surveillance nightmare represents for others nothing less than the solution to virtually all problems, from climate protection to the automatic reordering of laundry detergent. Whatever one’s perspective, the number of sensors - and thus the amount of data -will continue to grow.
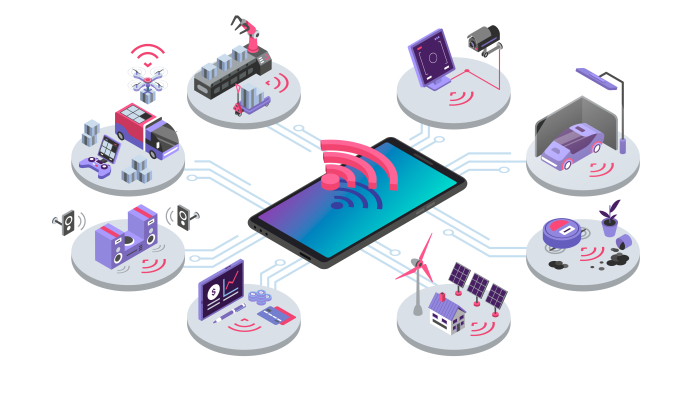
Figure 10.8: Internet of Things (Source: Adobe Stock).
Further links on sensor technology:
- How commonly installed smartphone sensors work.
- Overview of sensors on the Android developer website. Note how many sensors provide information about absolute and relative spatial position.
- Trends related to sensor technology trends in the IoT environment.
In addition to sensors that passively generate and transmit data, there is also a trend toward compact, low-cost models in the field of sensors used for active data acquisition. High expectations are particularly associated with UAVs (Unmanned Aerial Vehicles), commonly referred to as drones. These make it possible to collect relatively inexpensive remote sensing data (ranging from multispectral cameras to laser scanning) and subsequently process it into high-quality geospatial products, such as high-resolution building models. In Module 3, you will explore this topic in greater detail.
Further links on UAV technology:
- This video presents current drone trends.
- Drones in the GIS sector – applications and trends.
- Drones for surveying and data acquisition.
Closely related to passive and active (geo-)data acquisition is the issue of positioning. In this context, GNSS devices played a central role in the past. GNSS, which stands for Global Navigation Satellite System, is the umbrella term for satellite navigation systems such as the Global Positioning System (GPS) and Galileo. Currently, the trend is toward combined or alternative positioning technologies. This means that multiple sensors are used together for positioning, or that alternatives to GNSS are employed. While improved accuracy is one reason for combining multiple sensors, an even more important motivation is the possibility of indoor positioning and navigation, as GNSS is either unavailable or performs poorly inside buildings or in dense urban canyons. For this reason, more and more devices and applications are turning to alternative sensors for positioning. In addition to Wi-Fi, these include primarily Bluetooth and RFID, which has long been used for goods tracking in the logistics sector. An overview of the different indoor positioning technologies can be found here.
The amount of data generated by the sensors and technologies described so far is enormous. Managing it will be one of the central challenges of the future. Even though IT infrastructure capacities are constantly being expanded, they are far from sufficient to store all the collected data, let alone process it meaningfully. The “haystack of data” is highly dynamic, and finding the “needle” (the relevant information) is the task of intelligent database architectures and algorithms. Geographic space plays a key role here as the reference framework for the data stream. Have a look at Figure 10.9:
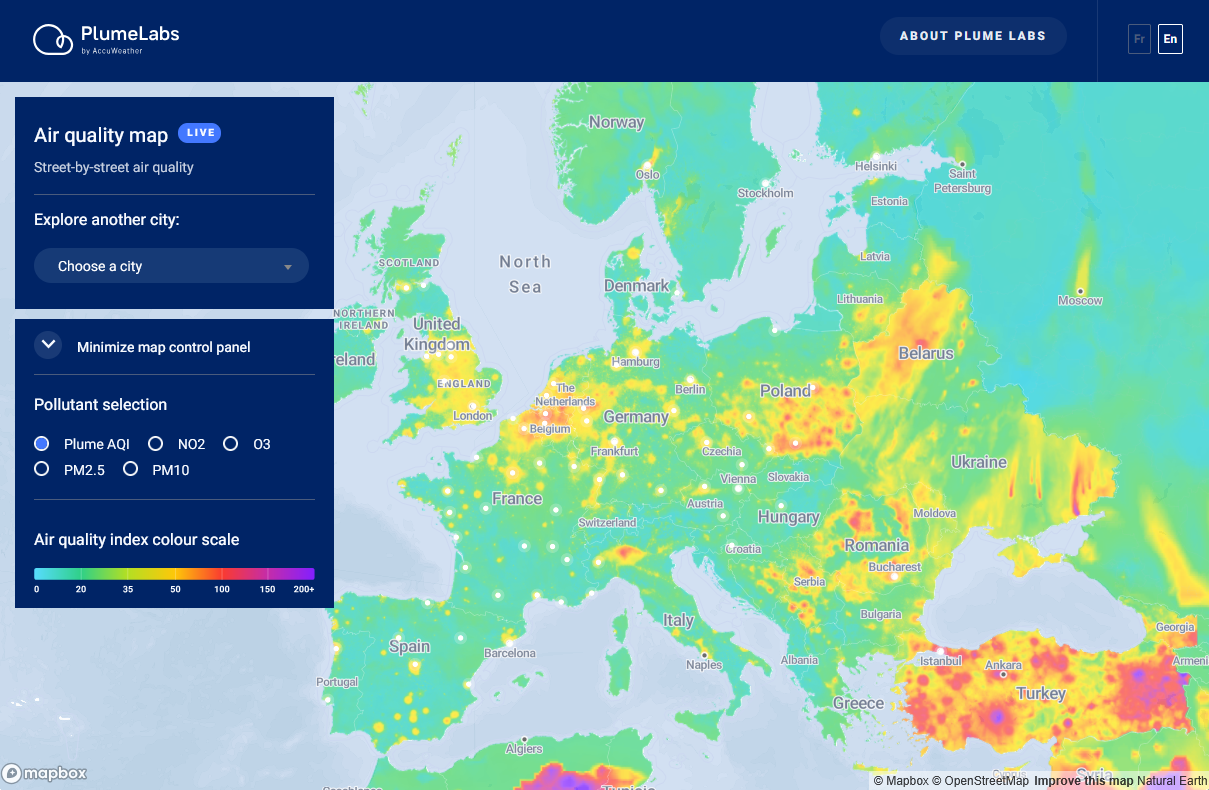
Figure 10.9: An example of a data stream from the environmental sector is the air quality map by PlumeLabs, which shows current air quality based on ground-based measurements and satellite imagery services.
The availability of these data and the technologies to process them are accompanied by applications and paradigms that, until recently, would have seemed like science fiction, but now have the potential to fundamentally change aspects of everyday life and society. Geographic information plays a central role in several of these areas, including:
- Smart Cities: This refers to the digitisation of urban facilities and actors to increase efficiency in various areas. Particular focus is placed on energy efficiency, traffic management, and utility infrastructure.
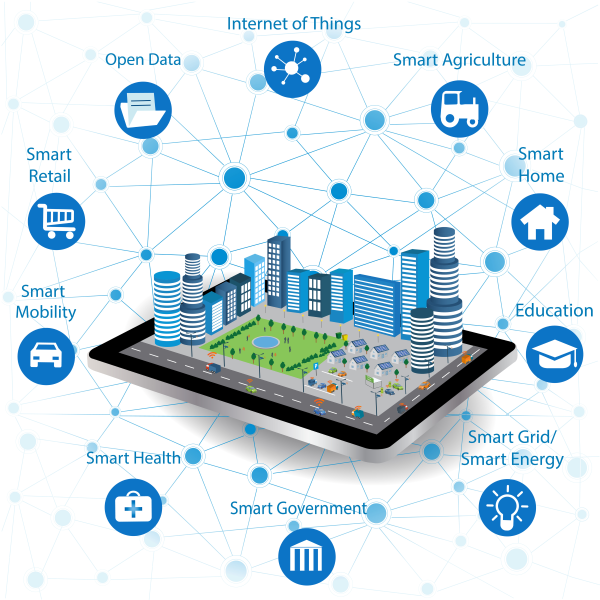
Figure 10.10: Almost all urban processes have a spatial component, whether it is traffic, energy, the environment, or social infrastructure. Combined with GIS, IoT, and AI, sensor data can be transformed into intelligent platforms designed to make cities more efficient, sustainable, and livable. (Source: Adobe Stock).
- Smart Homes: Through the digital networks of devices and control systems, everyday routines in households can be optimised and made generally “smarter.” There, it is important to know who or what is located where at any given time. For example, when you leave your home, the gas on the stove is automatically turned off and the room temperature is lowered. Multiple interconnected Smart Homes can, in turn, be part of Smart Cities. This allows, for instance, the optimisation of utility network loads, the supply of fresh water, or the allocation of internet bandwidth. If you are interested in this topic, you can find examples of Smart Home systems here.
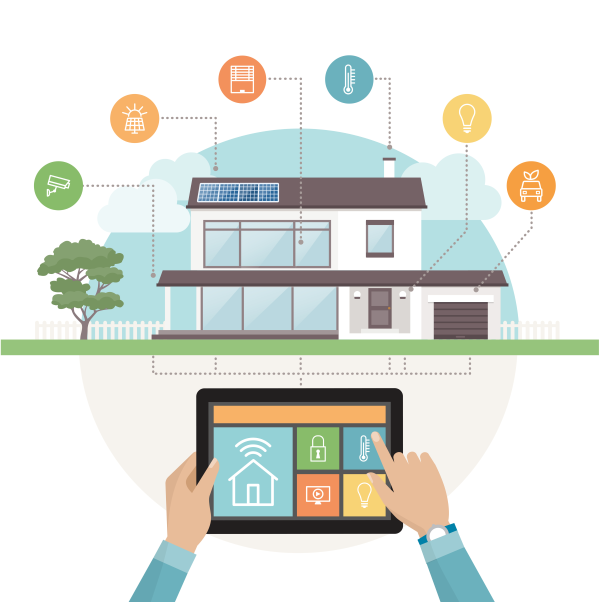
Figure 10.11: Smart Home (Source: Adobe Stock).
- Autonomous Vehicles: Also, cars are increasingly being integrated into and connected with the digital environment. To make the vision of self-driving cars a reality, highly accurate geospatial data for navigation on road networks is required, in addition to advanced sensor technology.
With the concept of Smart Cities and interconnected systems come immediate questions of privacy and data protection. At the Responsible Sensing Lab run by the City of Amsterdam, research is being conducted on the ethical considerations for the use of sensor technologies. If you have the time and interest, explore the various examples and consider the spatial implications associated with them.
10.5 Artificial Intelligence
The term “Artificial Intelligence” is associated with all kinds of promises, dystopias, and innovations. Since the release of ChatGPT by OpenAI by the end of 2022, the field has developed rapidly, giving rise to numerous other AI chatbots with enhanced capabilities. The underlying concepts and algorithms - many of which also have applications in Geoinformatics - are in some cases several decades old. What is new today is the vastly increased computing power and the availability of unimaginably large datasets (see the previous section). Plenty of reasons to spend a few minutes exploring the topic.
Artificial Intelligence (AI) is not uniformly defined, and its meaning varies depending on the context. The term was first introduced in the 1950s by John McCarthy and colleagues (McCarthy et al. 2006). The goal at the time was to abstract human learning and decision-making processes and model them in a way that machines could process. Similar objectives are still pursued today, 75 years later. The driving forces behind AI, in addition to research institutions and the defense and security industries, are primarily companies whose business models revolve around processing massive amounts of data. Notable examples include Microsoft, Amazon, OpenAI, Google, and Meta, along with their counterparts, for instance, in China.
![What exactly is AI? [@Hao2018]. You can read the article related to the image in the <a href='https://www.technologyreview.com/2018/11/10/139137/is-this-ai-we-drew-you-a-flowchart-to-work-it-out/' target='_blank'>MIT Technology Review</a>.](images/ai-flowchart.png)
Figure 10.12: What exactly is AI? (Hao 2018). You can read the article related to the image in the MIT Technology Review.
Much of what is today referred to as artificial intelligence consists of algorithms for machine learning and a subgroup known as deep learning. These algorithms power everything from recommendations on Amazon and Netflix to applications in facial and speech recognition, robotics, medicine, time-series analysis, and photo and video editing. Machine learning is modelled on human cognitive processes, which are represented in so-called neural networks. The focus is not on memorising large amounts of information, but on recognising relationships, rules, and patterns. For example, as humans, we “know” what a face looks like: it is located on the front of the head and always consists of two eyes, a nose, a mouth, and so on. Therefore, we do not need to memorise every face; even when encountering a completely unfamiliar person, we can immediately recognise that they have a face.
Machine learning is generally divided into supervised, unsupervised, and reinforcement learning. In the first category, data in a test set is labeled and classified, allowing the algorithm to know what to look for, similar to a sniffer dog. In the second category, the data is analysed statistically for clusters and dependencies without prior human classification. Reinforcement learning operates according to a trial-and-error principle: all possible paths are explored, and those that bring the system closer to the goal are “rewarded.” A more detailed explanation of the different algorithmic approaches can be found, for example, here.
If you are interested, here are some additional resources on artificial intelligence in general and AI in GIS:
- What is Artificial Intelligence (AI) – a detailed summary by the International Organization for Standardization (ISO).
- ESRI e-book on Artificial Intelligence and GIS.
- Resources on GeoAI from Esri.
- The Rise of Machine Learning: Artificial Intelligence and GIS.
A key goal in the application of artificial intelligence is to extract relevant information from seemingly nonspecific data noise. The spatial context provides an additional organisational framework for this. Let us illustrate this with a short, simple example (in Figure 10.13):

Figure 10.13: Here you essentially see the same objects: sun loungers, umbrellas, water, sky, brown-gray ground, and palm trees. Yet at first glance, you can identify the left image as a built environment of a pool area and the right as a natural beach.
Why is that? Geometric properties such as shape and size, as well as the spatial relationships between objects, define the spatial context and help identify individual objects or groups of objects. In a GIS, these properties can be described formally. Based on geographic location, additional spatial data layers can also be incorporated into the analysis.
Artificial intelligence already has a significant impact on geoinformatics in many areas. In the future, numerous activities along the geoinformatics value chain are likely to be replaced by AI applications. Nevertheless, it should be noted that some problems - while easily solvable by you after this module - can still overwhelm machine learning algorithms. For example, a group of researchers at Uber demonstrated this using a simple coordinate transformation.
The following four examples of AI applications in Geoinformatics illustrate a rapidly growing field and highlight the emerging possibilities in this area.
10.5.1 AI in Data Acquisition
A highly accurate representation of the environment is crucial for many applications. Thanks to major advances in sensor technology, data is being generated at unprecedented resolution. Artificial intelligence is used to process these large volumes of data effectively, and - above all - to extract information relevant for a specific goal.
Figure 10.14: Video (1:54). HERE Technologies uses deep learning algorithms to extract 3D road geometries from LiDAR data.
Further reading
- MapAI 2023 – Presentation Videos & Collaborative Results of the Pre-ICC Workshop on Cartography and AI at the ICA conference will give you an overview of current research in this area (ICA Commission on Geovisualization (icaci.org)).
- Expanding Mapping Capabilities with Deep Learning.
- Maps Accurate to the Centimetre.
10.5.2 AI in Image Analysis
Not only are road networks being surveyed today more than ever- driven by the trend of autonomous driving - but never before have so many Earth observation satellites been in orbit as there are today. Here too, the question arises of how to process and analyse the resulting data:
Figure 10.15: Video (5:08) Interview with Einar BjØrgo Manager of UNOSAT (United Nations Satellite Centre) on the Impact of AI on Satellite Analysis.
Neural networks and deep learning algorithms have long been used in the analysis of remote sensing data. They are often applied to delineate and identify objects or spatial units. Artificial intelligence, for example, makes it possible to perform land use classifications automatically (Figure 10.16):
![Land-cover classification by AI [@lubej2019]. If you want to get detailed information read this <a href='https://medium.com/sentinel-hub/land-cover-classification-with-eo-learn-part-2-bd9aa86f8500' target='_blank'>blog article</a>.](images/AI-landuse-class.png)
Figure 10.16: Land-cover classification by AI (Lubej 2019). If you want to get detailed information read this blog article.
Further reading
- Janga, B.; Asamani, G.P.; Sun, Z.; Cristea, N. A Review of Practical AI for Remote Sensing in Earth Sciences. Remote Sens. 2023, 15, 4112.
- Explore the use of AI and data science for image analysis.
- StoryMap on “GeoAI: Machine Learning & Deep Learning with GIS”.
10.5.3 AI in Autonomous Driving and Traffic Management
Traffic situations are highly complex and cannot be fully covered by rules. This is why drones, image recognition, and artificial intelligence play an important role in creating the future of driving. By analysing data from different sources, the trajectories of various traffic participants can be predicted:
Figure 10.17: Video (00:36) - Automated solutions from the company DataFromSky for detecting near-miss accidents.
Artificial intelligence is also increasingly being integrated directly into vehicles. This applies to current models implemented in driver-vehicle communication (e.g., speech recognition) as well as to various assistance systems. To deploy autonomous vehicles on a large scale in the future, the use of AI is essential. Autonomous vehicles are equipped with cameras, sensors, and communication systems that generate enormous amounts of data (e.g. Figure 10.18). Without artificial intelligence, this data could not be processed and interpreted to allow the vehicle to see, hear, “think,” and make decisions.
![Components of AI in Autonomous Cars [@gadam2018]. For further information, have look at the full <a href='https://medium.com/datadriveninvestor/artificial-intelligence-and-autonomous-vehicles-ae877feb6cd2' target='_blank'>article</a>](images/autonomous-vehicles-ai.png)
Figure 10.18: Components of AI in Autonomous Cars (Gadam 2018). For further information, have look at the full article
Further reading
- AI in Traffic Management.
- Bird’s AI View: Harnessing Drones to Improve Traffic Flow.
- Data from the Sky offers AI-solutions for the traffic sector.
- Example for AI in autonomous vehicles.
- Movement data and GIS.
10.5.4 AI in Precision Farming
To meet the growing demand for food amid limited availability of agricultural land and water, it is necessary to operate agriculture as efficiently as possible. AI models now play an important role by, for example, improving yield forecasts and assisting in the detection of growth stages, stress factors, or disease infestations. Large amounts of data from satellites, UAVs, and sensors are analysed to make the most accurate predictions possible and provide recommendations for farm management.
Watch the video 10.19 about a platform developed at DFKI that uses AI and Sentinel-2 satellite data to generate crop forecasts. The AI model was trained to recognise and classify different crops and to derive predictions regarding the expected yield.
Figure 10.19: Video (3:13) - From Space to Soil: How AI and Satellites Predict Crop Yields with Precision (by DFKI).
10.6 Scalability and Cloud Computing
The outsourcing of IT infrastructure, platforms, or software to the Internet - collectively referred to as cloud computing - is a trend that has been around for several years and is evident in many everyday applications, such as email services or photo and video platforms. Despite the already extensive application of cloud computing, its full potential in the development of more applications has not yet been achieved, although the COVID-19 pandemic provided a tremendous boost to the cloud solutions market.
In 2021, the ZDNet portal provided an overview of the revenues of leading cloud computing providers, with Amazon Web Services at the top. However, with the advent of AI, things are about to change.
While the technology of cloud computing is not new, the tremendous computing power and availability of adequate bandwidth for data transmission has resulted in a new business model: One in which everything, ranging from a simple application to a complete IT infrastructure, can be offered by or outsourced to service providers in the cloud (e.g., Amazon). One must only pay for the performance (pay-as-you-go). Known applications that implement cloud computing are Google Docs, Microsoft Office Online, Flickr, Dropbox, and various webmail services.
Cloud computing in the GIS field is common in various forms, from data storage to the outsourcing of entire system functionalities to the cloud. While a client-server architecture requires every organisational unit to operate and maintain its own server infrastructure and software, cloud computing establishes and provides a more customised approach, wherein functionality can be delegated to different servers in the cloud.
For most GIS users, the adoption of cloud computing is particularly evident when using GIS applications directly in a web browser, such as ArcGIS Online. This means that for storing, analysing, and visualising geospatial data, neither a GIS program nor local copies of the data are required. A web browser and sufficient bandwidth are all that is needed. For GIS service providers, moving to the cloud offers the advantages of reducing fixed costs and avoiding capacity bottlenecks. For example, the Swiss spatial data viewer map.geo.admin is outsourced to the Amazon cloud. Due to the scalability of the infrastructure, services are offered without delay even during heavy traffic (see Figure 10.20).
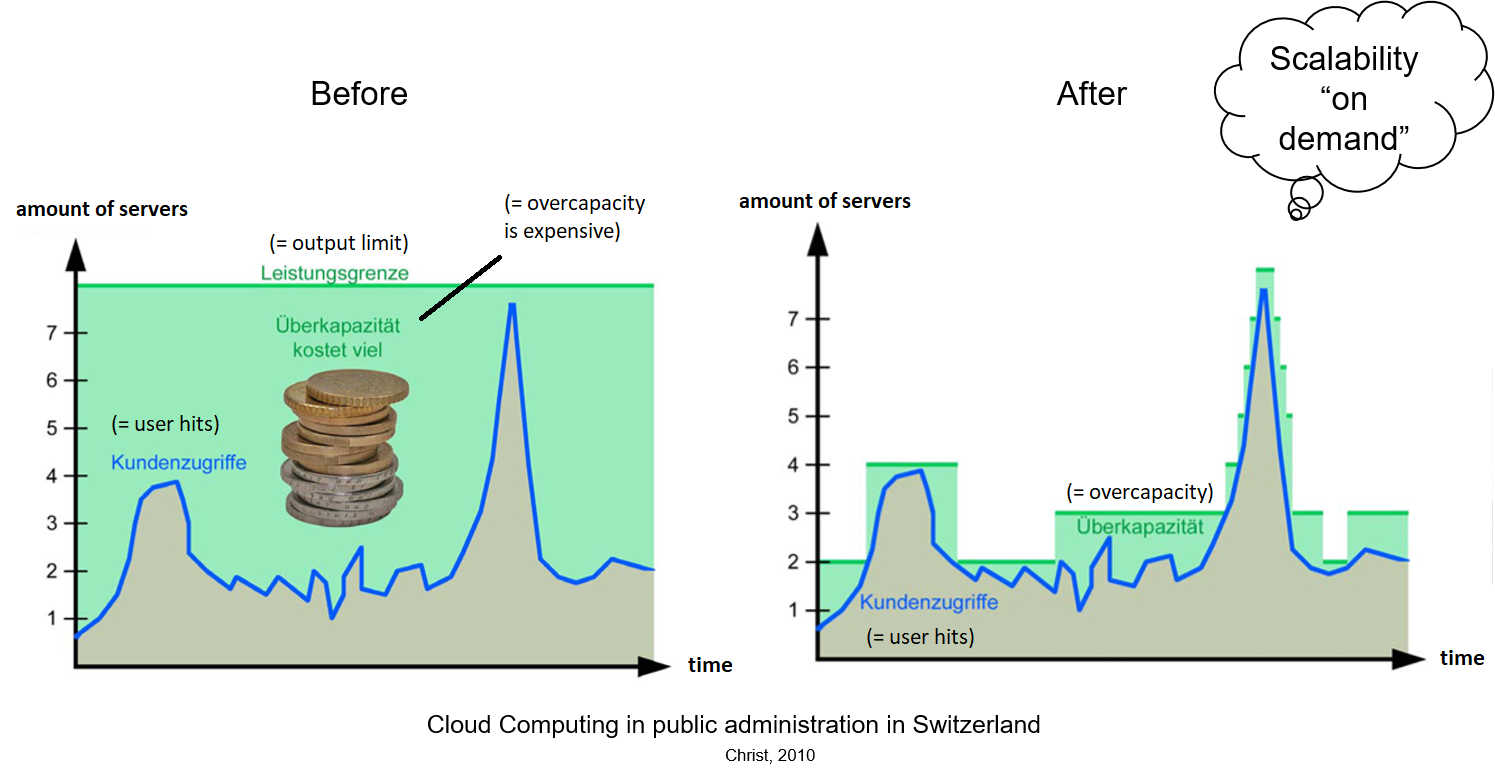
Figure 10.20: The pay-as-you-go model (modified, i.e. translated, after Christ (2010): Cloud computing in public administration in Switzerland (map.geo.admin)).
For highly computationally intensive processes, the cloud is often the only practical solution. Consequently, virtually all GIS software companies offer the option to run AI applications in the cloud - applications that would require enormous resources to operate locally.
Although expectations regarding the potential and future development of cloud-based GIS services are high, several unresolved issues remain. These particularly include the ability to determine the location and ownership of data stored in the cloud, as well as limited options for transferring services to an alternative cloud provider (the risk of “vendor lock-in”). These concerns partly explain the continued reluctance of public authorities and governmental bodies to fully commit to cloud-based GIS services.
Given the relatively high licensing and infrastructure costs of traditional, “local” GIS-systems, cloud-based GIS services, alongside the use of open-source products, are an economically attractive option. This particularly applies for smaller companies with the need to access specific GIS-services only occasionally, since cloud solutions operate on a pay-per-use basis. For providers of resource-intensive services with significant fluctuations in demand, cloud-based GIS services also offer the advantage of flexible scalability without the need to further expand their own IT-infrastructure.
For further reading:
10.7 Open Source Software & Open Data
The term “Open Source Software (OSS)” encompasses a wide range of licensing models. What they all have in common is the disclosure of the source code and the possibility for users to further develop and modify the software.
Open Source Software and free data per se are nothing really new. What is new (at least for the European Union) is that an increasing number of companies and government agencies build their entire GI-infrastructure on OSS and/or provide any officially collected data on the internet free of charge. Since the licensing of the open operating system Linux in 1992, Open-Source Software has matured to be a serious alternative to commercial products. In GIS applications, this development first took place in the (map)server and in database infrastructure. Based on this, desktop GIS-software has matured to such a degree that they are now suitable for everyday use due to, e.g., ease of use, stability, or functionality.
In the area of GIS, this development first took place in (map) servers and database infrastructure. Building on this, over the past few years, several open-source desktop GIS applications have evolved to the point where they are suitable for everyday use in all respects, including user-friendliness, stability, and functionality. One of the best-known and most widely used open-source GIS-systems is QGIS, also within UNIGIS :-)
An increasing number of public authorities and private companies hope to achieve both cost savings and innovation potential through the use of open-source GIS software. The advantages of using OS products are obvious:
Shorter innovation cycles through an on-going development while the OS product itself remains available.
Direct communication with developers and users through web forums and community meetings.
Distributed development costs
No licencing fees
Scalability and flexibility through open source code: OSS can be precisely tailored to meet specific user needs, provided that the necessary skills are available in-house or can be acquired externally.
Platform independence as OSS is usually designed for any operating system.
What still limits the wider adoption of open-source GIS software are the migration effort, uncertainties regarding support and stability, existing commitments through long-term contracts, and a comparatively greater “trust” in established system providers. The more cultural reservations toward open-source software are sometimes linked to the identity of the respective providers: commercial vendors sell a ready-to-use product, whereas using open-source software is more akin to participating in a project.
Currently, it is mainly larger companies or authorities, and one-person companies that use OS GI-software for different reasons. With acceptably stable applications, this trend will continue in the future and find its way into a wide variety of GIS-applications. And after all, to use OS GI-software successfully, a fundamental openness to the open-source idea and basic GIS and/or programming are necessary.
If you are interested, here are some additional resources on open-source software:
Overview of various licensing models.
The Open Source Geospatial Foundation (OSGeo): a non-profit organisation whose mission is to promote the global adoption of open geospatial technologies.
Closely linked to the idea of open-source software is the free and transparent provision of data, collectively referred to as open data.
What has long been common practice in the United States has now also gained ground in Europe. The United Kingdom, once particularly restrictive, is now considered a pioneer in the provision of government data. Initiatives of the European Union such as data.europa.eu continue to drive this development forward.
The benefits of open data are manifold (Figure 10.21), ranging from improved efficiency in public administration and economic growth in the private sector to societal gains in the form of transparency and citizen participation.
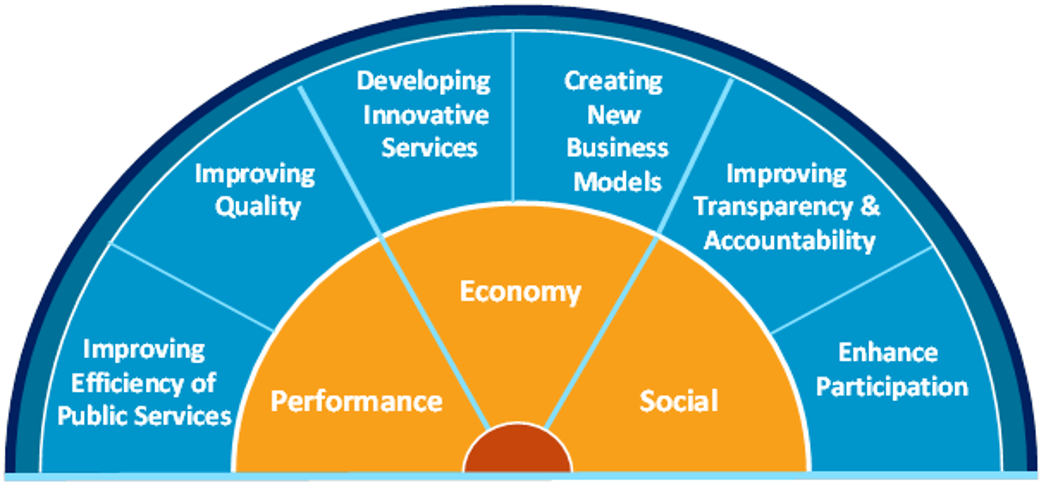
Figure 10.21: The benefits of open data (image source: data.europa.eu).
Many countries, cities, and other public authorities have already succeeded in turning the idea of open data into practice, which has led to a high number of innovative applications. One example is the online map showing the live locations of subways in the City of London, with the data provided as open data by Transport for London, or the Open Budget Portal provided by the federal government of Austria (unfortunately only available in German language).
If you are interested, here are some additional resources on open data:
The USA as a pioneer in open data.
Swisstopo provides all geospatial base data and products free of charge for download.
Examples from Germany, Austria, and Switzerland: Berlin (in German language), Vienna, Zurich (in German language).
The Open Data Handbook covers the legal, social, and technical aspects of open data.
10.8 Digital Twins
Regardless of the field someone is working in as a GIS specialist, the concept of the digital twin is hard to ignore today. So, what makes a digital twin unique, and how does it differ from a geospatial data infrastructure with built-in modelling and analysis capabilities?
Figure 10.22: Digital Twin of Singapure.
Many buzzwords that appear in the context of digital twins strongly recall the Smart City hype of a few years ago. In fact, numerous industry players today are once again key drivers in popularising and establishing digital twins. However, this should not prevent us from briefly examining the significance of this development for Geoinformatics, and vice versa.
A digital twin is essentially a detailed digital representation of reality that is updated in real time. In this virtual half of the twin, decisions can be safely tested based on analyses and simulations before being implemented in the real world (if the results are positive).
Digital twins are not inherently limited to the physical space. They have, for example, already been used for some time in plant engineering and medicine. Another characteristic of digital twins is the integration of multiple “domain silos”, especially when systems with a geographic reference (e.g., cities or nature reserves) are represented. For this purpose, digital twins must go beyond merely representing objects. The underlying processes and the dependencies between objects are also explicitly modelled. This enables systemic approaches that can capture the effects of interventions on multiple levels. For instance, reciprocal dependencies (interdependencies) are taken into account in decision-making processes.
In recent years, a convergence of developments has been observed, now resulting in GIS-functionalities being at the core of many digital twins. This includes, on the one hand, the Internet of Things and sensor networks, which generate real-time data that are managed in Geographic Information Systems. On the other hand, the ongoing integration of GIS and Building Information Modelling (BIM), along with corresponding 3D-visualisation and analysis capabilities, also plays a crucial role. In addition to these relatively recent developments, geoinformatics offers a wealth of established concepts and technologies that contribute to the technological foundation of digital twins. These include standardised formats, protocols, and interfaces, as well as proven tools for analysing, visualising, and simulating large, sometimes heterogeneous datasets. Moreover, geoinformatics has long served as a cross-cutting technology. Terminologies, concepts, and requirements from diverse sectors - such as energy supply, agriculture, disaster management, and real estate - have been implemented in Geographic Information Systems for many years.
Until now, these models were implemented mainly as “islands”. For the digital visualisation of landscapes, in the spatial modules (Landscape Information Model - LIM) usually are integrated different layers of information of natural or social aspects (e.g., a digital twin of a rainforest). ESRI’s Living Atlas is such an example. Network models (Network Information Model - NIM) usually manage infrastructures, like supply chains or road networks. GE Vernova’s software is widely used in this field. City Information Models (CIM) are used for the representation and analysis of entire cities or part thereof (e.g. transportation network) in context of smart cities (which discussed in a previous section). An important role here plays the CityGML, the OGC (Open Geospatial Consortium) standard markup language developed for these models. The information models for individual buildings and building complexes (BIM) are closely related but are large-scaled and provide higher level of details. In ESRI’s video 10.23 it is explained the integration of GIS and BIM.
Figure 10.23: Video (01:04:10). GIS and Building Information Models (BIM) are increasingly merging.
To link information models as described above, GIS and their functionalities are particularly well suited. The following four steps outline a typical lifecycle for a digital twin:
- Data collection and integration
- Real-time processing and visualisation
- Analysis and simulation
- Publication and collaboration
Geographic space is a powerful key for establishing connections between individual information models and enabling overarching processes across the outlined lifecycle. A digital twin designed in this way is less a single, standalone system and more an ecosystem of applications and functionalities. In addition to the necessary technology, organisational aspects play a central role. For this purpose, experts are needed who can operate “multilingually” at the interface of different specialised applications: a role that is ideally suited for you as a future UNIGIS graduate :-).
For those interested, have a look at ESRI’s Tutorials for BIM-GIS Integration.
10.9 The Future of GIS
Given the widespread availability of user-friendly web applications for geospatial data analysis and visualisation, the need for specialised GIS-developers and practitioners is obviously an important question at the beginning of your UNIGIS studies.
The question: “Can I attach a value to everything I have learned?” may currently be in any case answered with: “Yes”!
There are several reasons why:
- The GI-industry remains an emerging field, as technological and societal trends are heavily shaped by digitalisation. This is closely linked to the potential to generate added value for numerous processes and analyses through a spatial perspective. Competence in using GIS, as well as the ability to integrate different applications domains and methodological approaches based on geographic coordinates, will continue to be in high demand in the future (see the Geospatial Technology Competency Model or growth of GIS market size).
- The spatial dimension supports the integration of data from a wide variety of sensors and domains. Whether it involves sensor networks in a smart city, the aggregation of data sources in a dashboard, or the overlay of the physical world with a virtual layer: the spatial reference – or in other words, the spatial relationships between elements - is used as a common denominator.
- The larger the scale of GI-technology, the greater the need for experts: GIS not only enhances the efficiency of public services but also compels an increasing number of employees to work with geospatial data in compliance with legal requirements, such as the mandatory implementation of the INSPIRE Directive. Furthermore, the private sector has discovered the added value of Geoinformatics, be it a tool for their own area of expertise or as a foundation for new, innovative business models.
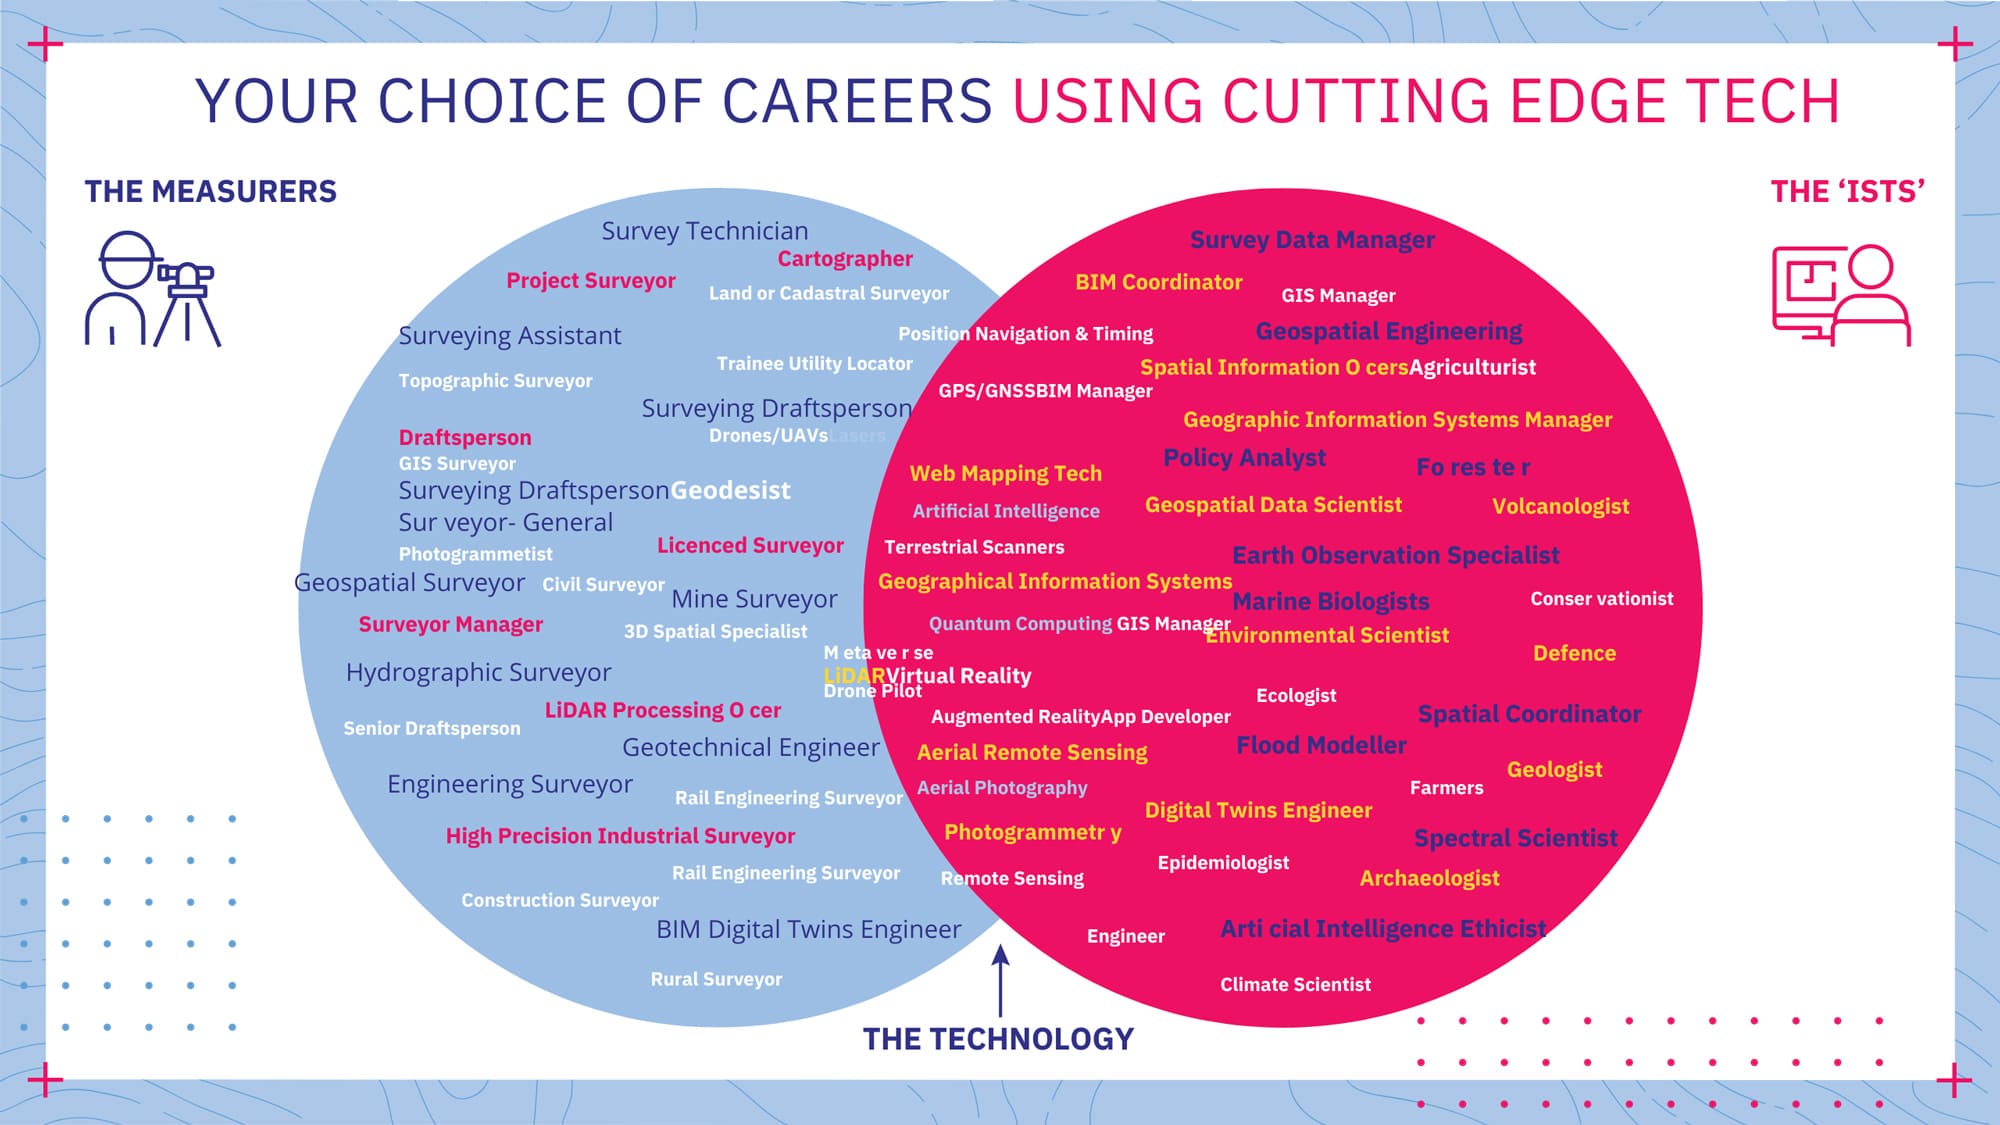
Figure 10.24: Geoinformatics and career opportunities (source: Geospatial Council of Australia).
The diversity of application domains and the widespread use of geoinformation technologies across numerous economic sectors provide a broad range of career opportunities for you as a UNIGIS student. While just a few years ago creating digital maps was often sufficient for a GIS professional, today’s job market demands a significantly more complex and specialised skill set, including the integration of diverse data sources, working with 3D and real-time data, and the application of AI-supported analytical method.
A solid foundation in the fundamental concepts and methods of Geographic Information Systems is essential for effectively acquiring and applying these specialised skills. Hence, the upcoming modules in the UNIGIS program will focus on these core concepts and methods, providing a solid basis for your further personal specialisation.